Figures & data
Table 1 Clinicopathologic Features of miR-423 Expression in TCGA Breast Cancer Cohort
Table 2 Clinicopathologic Features of miR-423 Expression in SYSUCC Cohort
Figure 1 miR-423 is upregulated in human breast cancer and correlates with poor prognosis. (A) Analysis of miR-423 expressions in TCGA BRCA cohort data. (B) Analysis of miR-423 expressions between human breast cancer tissues and matched adjacent non-tumor tissues in TCGA BRCA cohort data (number of pairs = 104). (C) Analysis of miR-423 expression in different clinical stages of TCGA BRCA cohort data. The boundaries of the boxes represent the lower and upper quartiles, the lines within the boxes and whiskers denote the median and outer limits. (D) Analysis of miR-423 expression in different N (node metastasis) and M (distant metastasis) classifications of TCGA BRCA cohort data. The boundaries of the boxes represent the lower and upper quartiles, the lines within the boxes and whiskers denote the median and outer limits. (E) Real-time PCR analysis of miR-423 expression in breast cancer cell lines and normal breast epithelial cells (NBECs). Transcript levels were normalized to U6 expression. (F) Kaplan–Meier analysis of the correlation between the miR-423 level and the overall survival (OS) of breast cancer patients in TCGA BRCA cohort. Bars represent the mean ± SD of three independent experiments; **P < 0.01, *P < 0.05.
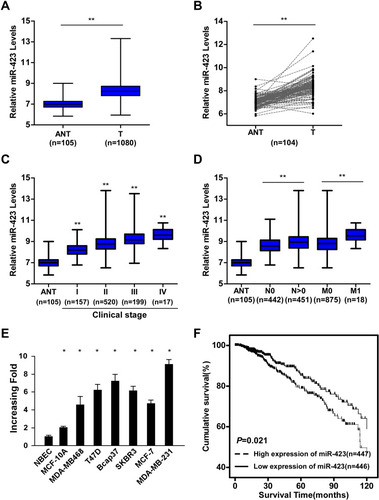
Figure 2 miR-423 promotes invasiveness of breast cancer cells. (A) Real-time PCR analysis of miR-423 expression in indicated cells. (B) Transwell assays performed with indicated cells, scale bar, 100 μm. (C) Relative quantification of cells in transwell assays with indicated cells. (D) 3D growth capacity showed with indicated cells. (E) Time course of wound healing assays performed with indicated cells. Bars represent the mean ± SD of three independent experiments; **P < 0.01.
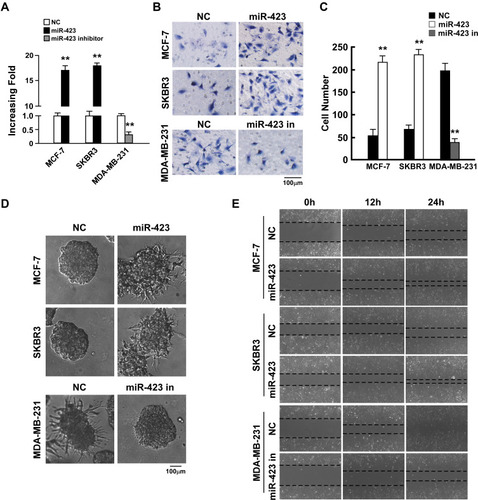
Figure 3 miR-423 directly targets TNIP2 in breast cancer cells. (A) Sequence of the TNIP2 3ʹ-UTR shows the miR-423 binding seed region and mutation of the TNIP2 3ʹ-UTR seed region. (B) TNIP2 protein expression in MCF-7 and SKBR3 cells transfected with miR-423 or negative control (NC). α-Tubulin was used as loading control. (C) TNIP2 protein expression in MDA-MB231 cells transfected with miR-423 inhibitor or negative control (NC). (D) Relative luciferase activity of MCF-7 and SKBR3 cells co-transfected with increasing amounts of miR-423 mimic oligonucleotides (20 and 50 nM), and the pGL3 control reporter, pGL3-TNIP2-3ʹUTR reporter, or pGL3-TNIP2-3ʹUTR-mu reporter. (E) Relative luciferase activity of MDA-MB-231 cells transfected with increasing amounts of miR-423 mimic oligonucleotides (20 and 50 nM) or miR-423 inhibitor oligonucleotides (20 and 50 nM). (F) Transwell assay of indicated cells. Bars represent the mean ± SD of three independent experiments; **P < 0.01,*P < 0.05.
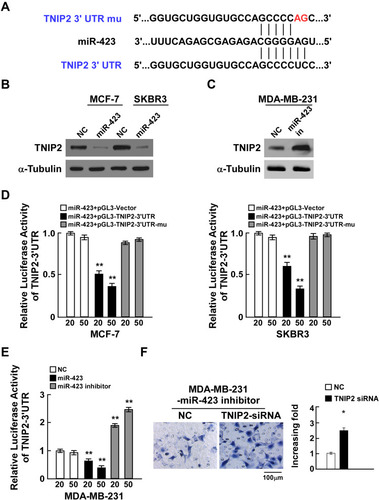
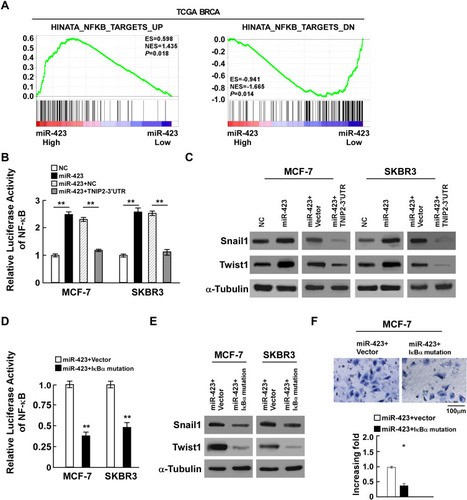
Figure 4 miR-423 activates the NF-κB pathway through regulation of TNIP2. (A) GSEA plot showing miR-423 expression was positively correlated with NF-κB-induced gene signature and AKT-activated gene signature, and inversely correlated with NF-κB-suppressed gene signature in TCGA BRCA cohorts. (B) Luciferase activity of NF-κB activity in indicated cells. (C) Western blot analysis of snail1 and twist1 expression in indicated cells, α-Tubulin was used as loading control. (D) Luciferase activity of NF-κB activity in miR-423 overexpressing cells with transfected the plasmids of vector or IκBα mutation. (E) Western blot analysis of snail and twist expression in miR-423 overexpressing cells with transfected the plasmids of vector or IκBα mutation, α-Tubulin was used as loading control. (F) Transwell assays showed the invasiveness of MCF-7 cells was inhibited in miR-423-overexpressing cells after transfected with IκBα mutation. Bars represent the mean ± SD of three independent experiments; **P < 0.01,*P < 0.05.