
Figures & data
Figure 1 ROC curves to assess the predictive value of preoperative fibrinogen, NLR and AGR. The cut-off values were 2.61 g/L for (A) fibrinogen, 1.90 for (B) NLR and 1.54 for (C) AGR; sensitivity, specificity and AUC: 80.4%, 67.9% and 0.770 for fibrinogen; 68.0%, 63.2% and 0.667 for NLR; 54.7%, 71.1% and 0.600 for AGR, respectively.
Abbreviations: NLR, neutrophil-to-lymphocyte ratio; AGR, albumin-to-globulin ratio.
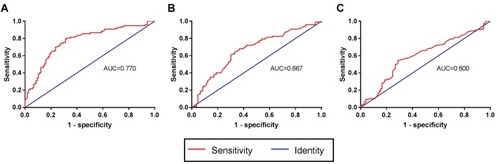
Table 1 Characteristics of Patients with Glioma
Table 2 Association Between F-NLR-AGR and the Clinicopathological Characteristics of Patients with Glioma (n=203)
Figure 2 Correlations between fibrinogen, NLR and AGR in glioma patients.
Notes: The figure is shown as a scatter plot. The fibrinogen was positively correlated with (A) NLR and negatively correlated with (B) AGR.
Abbreviations: NLR, neutrophil-to-lymphocyte ratio; AGR, albumin-to-globulin ratio.
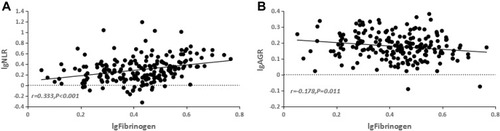
Figure 3 Correlations between fibrinogen, NLR, AGR, F-NLR-AGR and glioma grade.
Notes: The figure is shown as a scatter plot. (A) The diversity of fibrinogen in different glioma grades. (B) The diversity of NLR in different glioma grades. (C) The diversity of AGR in different glioma grades. (D) Distribution of F-NLR-AGR score in high-grade and low-grade glioma patients.
Abbreviations: NLR, neutrophil-to-lymphocyte ratio; AGR, albumin-to-globulin ratio; F-NLR-AGR, combination of fibrinogen, albumin to globulin ratio and neutrophil to lymphocyte ratio.
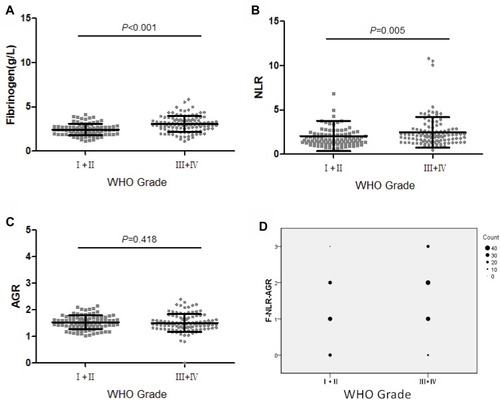
Figure 4 Kaplan-Meier survival curves for OS according to preoperative (A) fibrinogen, (B) NLR, (C) AGR, (D) F-NLR-AGR in patients with glioma.
Abbreviations: NLR, neutrophil-to-lymphocyte ratio; AGR, albumin-to-globulin ratio; OS, overall survival; F-NLR-AGR, combination of fibrinogen, albumin to globulin ratio and neutrophil to lymphocyte ratio.
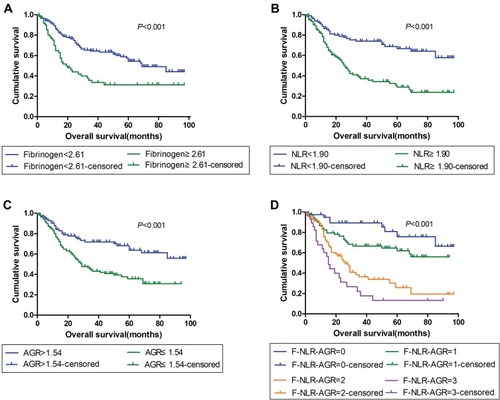
Table 3 The Univariate and Multivariate Cox Analyses of OS