Figures & data
Table 1 Association of TUG1 Expression with Clinicopathological Factors in PCa
Figure 1 Expression of TUG1 and its effect on prognosis and radiosensitivity in PCa. (A) The expression of TUG1 was measured by qRT-PCR analysis in PCa tissues (n = 50) or the adjacent non-cancer tissues. (B) The expression of TUG1 was measured by qRT-PCR analysis in human normal prostatic stromal immortalized cell line (WPMY-1) and PCa cell lines (LNCaP, 22RV1, PC-3 and DU145). (C) Survival was analyzed and compared between patients with high and low levels of TUG1 using Kaplan–Meier analysis. (D and E) TUG1 expression was detected in PC-3 and DU145 cells every 3 hrs after 0 or 4 Gy of radiation treatment. *P < 0.05.
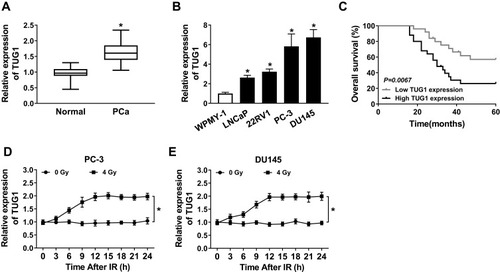
Figure 2 Knockdown of TUG1 enhanced radiosensitivity of PCa cell lines. (A) TUG1 expression in PC-3 and DU145 cells transfected with si-NC or si-TUG1 was detected by qRT-PCR analysis. (B and C) The cell viability of transfected PC-3 and DU145 cells at 0 hrs, 24 hrs, 48 hrs and 72hrs after radiation treatment. (D) Cell apoptosis was determined in transfected PC-3 and DU145 cells at 24 hrs after 4 Gy of radiotherapy. (E and F) The expression levels of apoptosis-related proteins (Bcl-2, Bax and cleaved-casp-3) were examined by Weston blot in PC-3 and DU145 cells transfected with si-NC or si-TUG1 at 24 hrs after 4 Gy of radiotherapy. (G and H) The clonogenic survival curve was established in Clonogenic assay after transfected PC-3 and DU145 cells subjected to 0, 2, 4, 6 and 8 Gy of irradiation. *P < 0.05.
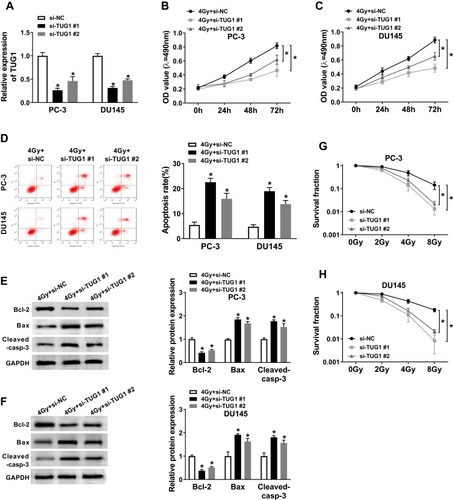
Figure 3 The expression of miR-139-5p was downregulated and negatively correlated with TUG1 in PCa samples and cell lines. (A) The presumed binding sites of miR-139-5p with TUG1 were predicted. (B and C) The luciferase activity in PC-3 and DU145 cells co-transfected with miR-139-5p mimics or mimics-NC and TUG1-WT or TUG1-MUT. (D) The expression of miR-139-5p was detected by qRT-PCR in PCa tissue samples. (E) The expression of miR-139-5p was negatively correlated with TUG1 in PCa samples by qRT-PCR. (F) The expression of miR-139-5p was detected by qRT-PCR. (G) The expression of miR-139-5p in PC-3 and DU145 cells transfected with si-NC, si-TUG1#1, pcDNA and pcDNA-TUG1 was measured by qRT-PCR. *P < 0.05.
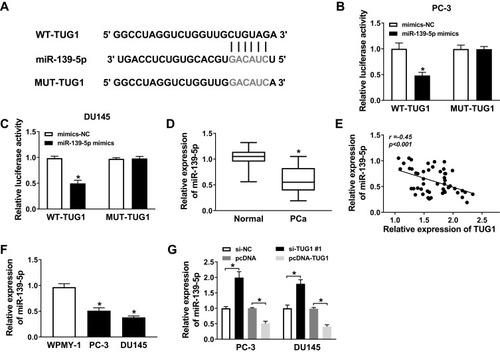
Figure 4 The inhibitor of miR-139-5p mitigated the effect of si-TUG1 on radiosensitivity, cell apoptosis, and survival fraction under 4 Gy radiation treatment. PC-3 and DU145 cells treated with irradiation were transfected with si-NC, si-TUG1#1, si-TUG1#1+ inhibitor NC or si-TUG1#1+ miR-139-5p inhibitor. (A and B) The expression of miR-139-5p was detected by qRT-PCR. (C and D) MTT assay detected the viability of PC-3 and DU145 cells. (E and F) Flow cytometry determined cell apoptosis of PC-3 and DU145 cells. (G and H) The expression level of apoptosis-related proteins (Bcl-2, Bax and cleaved-casp-3) was examined in PC-3 and DU145 cells. (I and J) The clonogenic survival curve was proven in PC-3 and DU145 cells, which were transfected with si-NC, si-TUG1#1, si-TUG1#1+ inhibitor NC or si-TUG1#1+ miR-139-5p inhibitor and subjected to 0, 2, 4, 6 and 8 Gy of irradiation. *P < 0.05.
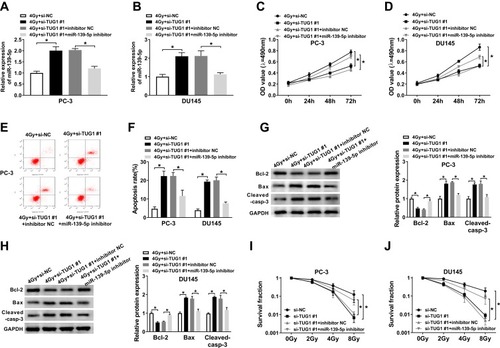
Figure 5 SMC1A was a target gene of miR-139-5p and the expression of SMC1A was upregulated in PCa cells. (A) The presumed binding sites of miR-139-5p with SMC1A were predicted. (B and C) The luciferase activity in PC-3 and DU145 cells simultaneously transfected with miR-139-5p mimics or mimics-NC and TUG1-WT or TUG1-MUT. (D) The expression of SMC1A was upregulated in PCa samples (n=50). (E) The relationship between SMC1A and miR-139-5p was analyzed by Kaplan–Meier analysis (r = −0.5646, P < 0.001). (F and G) The expression levels of SMC1A mRNA and protein were overexpressed in PC-3 and DU145 cells comparing to human normal prostatic stromal immortalized cell line (WPMY-1). (H and I) The mRNA and protein expression of SMC1A in PC-3 and DU145 cells transfected with miR-139-5p mimics or mimics-NC were detected by qRT-PCR and Weston blot, respectively. *P < 0.05.
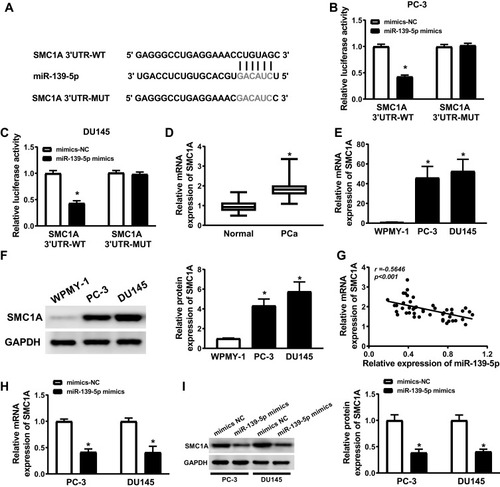
Figure 6 Restoration of HMGB1 expression reversed the improved radiosensitivity induced by TUG1 knockdown in PCa cells. (A and B) SMC1A mRNA and protein expression were detected by qRT-PCR and Weston blot in PC-3 and DU145 cells transfected with si-NC, si-TUG1#1, si-TUG1#1+ inhibitor NC or si-TUG1#1+ miR-139-5p inhibitor at 24 hrs. (C) SMC1A mRNA expression was positively correlated with TUG1 by qRT-PCR. (D and E) The expression of SMC1A was measured by qRT-PCR. (F and G) MTT assay detected the viability of PC-3 and DU145 cells transfected with si-NC, si-TUG1#1, si-TUG1#1+ pcDNA or si-TUG1#1+ pcDNA-SMC1A at the indicated time points (0 hrs, 24 hrs, 48 hrs and 72 hrs) after 4 Gy of radiation. (H and I) Flow cytometry determined cell apoptosis rate of PC-3 and DU145 cells transfected with si-NC, si-TUG1#1, si-TUG1#1+ pcDNA or si-TUG1#1+ SMC1A at 24 hrs after 4 Gy radiation. (J and K) The expression level of apoptosis-related proteins (Bcl-2, Bax and cleaved-casp-3) was tested by Weston blot in PC-3 and DU145 cells transfected with si-NC, si-TUG1#1, si-TUG1#1+ pcDNA or si-TUG1#1+ SMC1A at 24 hrs after 4 Gy radiation. (L and M) The survival fraction was established by Kaplan–Meier and log-rank in PC-3 and DU145 cells transfected with si-NC, si-TUG1#1, si-TUG1#1+ pcDNA or si-TUG1#1+ SMC1A and subjected to 0, 2, 4, 6 and 8 Gy of radiation. *P < 0.05.
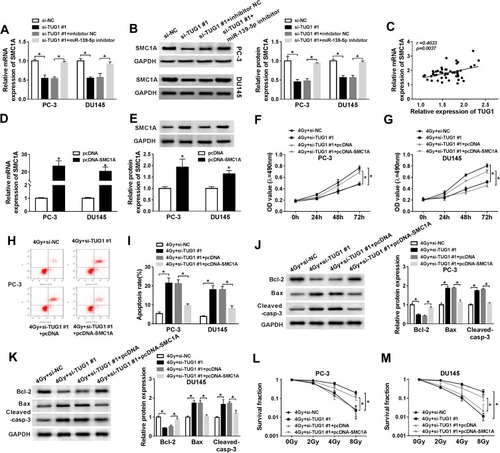
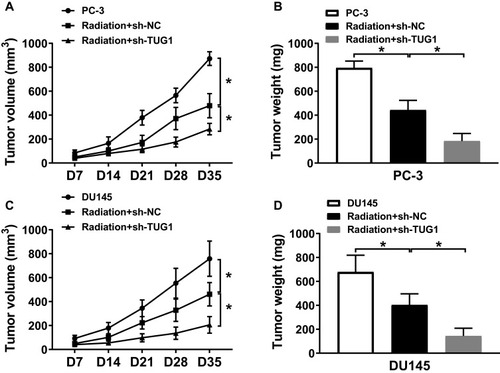
Figure 7 Knockdown of TUG1 enhanced the radiosensitivity of PCa cells in vivo. PC-3 and DU145 cells were transfected with sh-NC or sh-TUG1 and subcutaneously injected into the back of male nude mice (n = 5 per group). When the tumors reached an average volume of approximately 100 mm3, all mice were treated with 4 Gy radiation every 7 days. (A and C) Tumor volume was measured every 7 days after the first radiation. (B and D) Tumor weight was recorded after cultivating 35 days. *P < 0.05.