Figures & data
Figure 1 The expression of circ_0058124 in tissues and cells.
Notes: (A) Circ_0058124 expression in TC tissues (TC) and adjacent normal tissues (Normal) was detected by q-PCR. (B) Q-PCR was used to assess the expression of circ_0058124 in the different stages of TC (I+II and III+IV). (C) The expression of circ_0058124 in TC cell lines (BCPAP, TPC-1, IHH-4 and HTH83) and NTHY-ORI3.1 cells was measured by q-PCR. *P < 0.05.
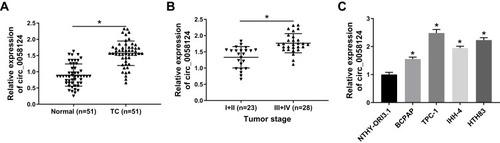
Figure 2 Identification and validation of circ_0058124 in TC cells.
Notes: (A) The relative expression levels of circ_0058124 and mFN1 in TPC-1 and HTH83 cells were analyzed by q-PCR after normalized with random primers and oligo (dT)18 primers. (B) The expression levels of circ_0058124, U6 and GAPDH in the nuclear and cytoplasmic of TPC-1 and HTH83 cells were detected by q-PCR after nuclear-cytoplasmic separation. (C) The relative expression levels of circ_0058124 and mFN1 in TPC-1 and HTH83 cells were assessed by q-PCR after treatment with RNase R. (D) The relative expression levels of circ_0058124 and mFN1 in TPC-1 and HTH83 cells were analyzed by q-PCR after treatment with ActD at the indicated time points. *P < 0.05.
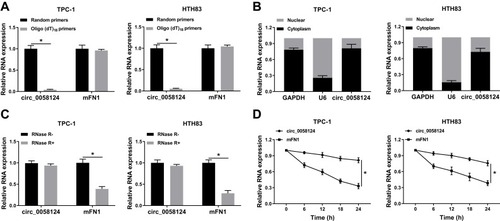
Figure 3 Effects of circ_0058124 on the progression of TC cells.
Notes: TPC-1 and HTH83 cells were transfected with si-circ_0058124 or si-NC. (A) The expression of circ_0058124 was detected by q-PCR to evaluate transfection efficiency. (B) Colony formation assay was used to measure the number of colonies in TPC-1 and HTH83 cells. (C and D) The number of migrated and invaded TPC-1 and HTH83 cells were determined by transwell assay. (E and F) The OCR of basal respiration and maximum respiration in TPC-1 and HTH83 cells was analyzed by Seahorse XF Extracellular Flux Analyzer. *P < 0.05.
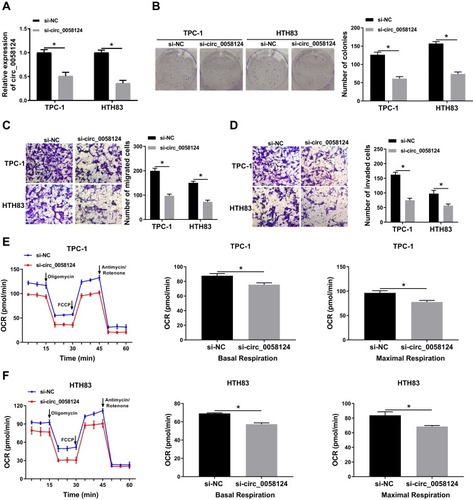
Figure 4 Circ_0058124 could sponge miR-940.
Notes: (A) The sequences of circ_0058124 containing the miR-940 binding sites or mutant binding sites were shown. (B) Dual-luciferase reporter assay was used to detect the interaction between miR-940 and circ_0058124 in TPC-1 and HTH83 cells. (C) The enrichment of circ_0058124 and miR-940 in anti-Ago2 or anti-IgG was determined by the RIP assay. (D) RNA pull-down assay was used to assess the enrichment of circ_0058124 in Bio-miR-940 or Bio-NC. (E) Q-PCR was performed to measure the expression of miR-940 in TC tissues (TC) and adjacent normal tissues (Normal). (F) The expression of miR-940 in TC cells (TPC-1 and HTH83) and NTHY-ORI3.1 cells was determined by q-PCR. (G) Circ_0058124 expression was determined by q-PCR to evaluate the transfection efficiency of circ_0058124 overexpression plasmid in TPC-1 and HTH83 cells. (H) The expression of miR-940 was detected by q-PCR in TPC-1 and HTH83 cells to assess the effects of si-circ_0058124 and circ_0058124 overexpression plasmid on miR-940 expression. *P < 0.05.
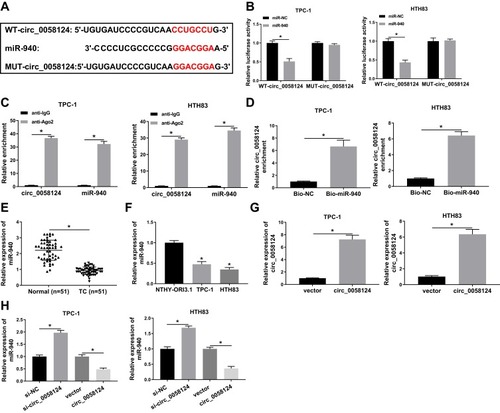
Figure 5 Effects of miR-940 on the progression of TC cells.
Notes: TPC-1 and HTH83 cells were co-transfected with miR-940 mimic and circ_0058124 overexpression plasmid. (A) Q-PCR was used to detect the expression of miR-940 to evaluate the transfection efficiency of miR-940 mimic and circ_0058124 overexpression plasmid. (B) The number of colonies in TPC-1 and HTH83 cells was measured by colony formation assay. (C and D) Transwell assay was used to determine the number of migrated and invaded TPC-1 and HTH83 cells. (E and F) Seahorse XF Extracellular Flux Analyzer was used to assess the OCR of basal respiration and maximum respiration in TPC-1 and HTH83 cells. *P < 0.05.
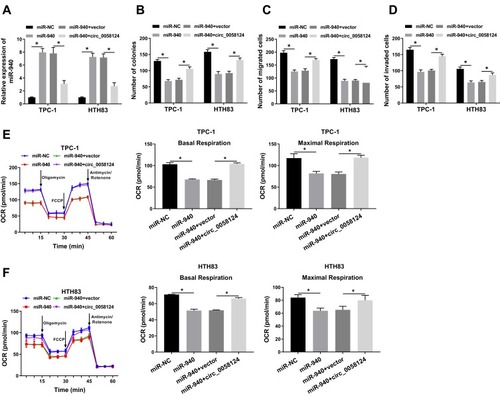
Figure 6 miR-940 could target MAPK1.
Notes: (A) The sequences of MAPK1 3ʹUTR containing the miR-940 binding sites or mutant binding sites were shown. (B) The interaction between miR-940 and MAPK1 in TPC-1 and HTH83 cells was assessed by dual-luciferase reporter assay. (C and D) The mRNA and protein expression levels of MAPK1 in TC tissues (TC) and adjacent normal tissues (Normal) were determined by q-PCR and WB analysis. (E) WB analysis was used to measure the MAPK1 protein level in TC cells (TPC-1 and HTH83) and NTHY-ORI3.1 cells. (F) The expression of miR-940 was detected by q-PCR to evaluate the transfection efficiency of anti-miR-940. (G) The effects of miR-940 mimic and inhibitor on the protein level of MAPK1 in TPC-1 and HTH83 cells were measured by WB analysis. *P < 0.05.
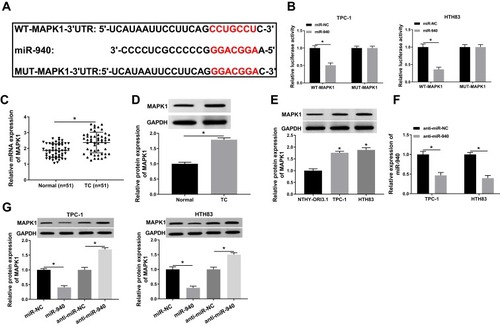
Figure 7 Effects of MAPK1 on the progression of TC cells.
Notes: TPC-1 and HTH83 cells were co-transfected with si-MAPK1 and anti-miR-940. (A) WB analysis was used to assess the protein level of MAPK1 to evaluate the transfection efficiency of si-MAPK1 and anti-miR-940. (B) Colony formation assay was performed to detect the number of colonies in TPC-1 and HTH83 cells. (C and D) Transwell assay was used to measure the number of migrated and invaded TPC-1 and HTH83 cells. (E and F) The OCR of basal respiration and maximum respiration in TPC-1 and HTH83 cells was determined by Seahorse XF Extracellular Flux Analyzer. *P < 0.05.
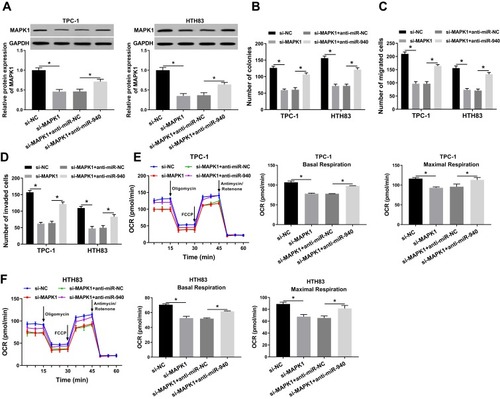
Figure 8 Effects of circ_0058124 and miR-940 on MAPK1 expression.
Notes: TPC-1 and HTH83 cells were co-transfected with circ_0058124 overexpression plasmid and miR-940 mimic. The protein level of MAPK1 in TPC-1 and HTH83 cells was measured by WB analysis. *P < 0.05.
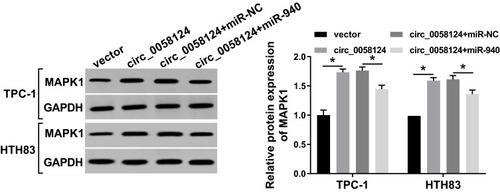
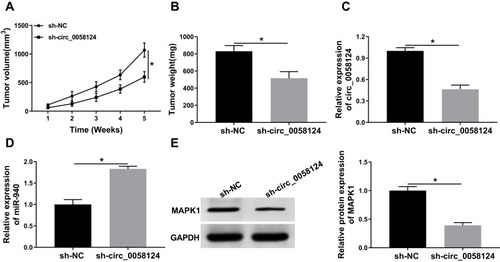
Figure 9 Effects of circ_0058124 on TC tumor growth in vivo.
Notes: (A) Tumor volume was calculated with length × width2/2 method at the indicated time points. (B) Tumor weight was measured in mice. (C) The expression of circ_0058124 was detected by q-PCR to evaluate the transfection efficiency of sh-circ_0058124. (D) MiR-940 expression was tested by q-PCR in tumors. (E) The protein level of MAPK1 was determined by WB analysis in tumors. *P < 0.05.