Figures & data
Figure 1 The expression of PHLPP in bortezomib-resistant MM cells. (A) Western blot analyses of the expression of PHLPP, LAMP2, and key autophagy signaling molecules in bone marrow samples from patients with MM (upper), and quantification of the bands (lower). (B) Western blot analyses of the expression of PHLPP, LAMP2, and key autophagy signaling molecules in U266 cells and bortezomib-resistant U266 cells (upper), and quantification of the bands (lower). MM-S, BTZ-sensitive MM; MM-R, BTZ-resistant MM; U266-R, BTZ-resistant U266 cells. *P < 0.05.
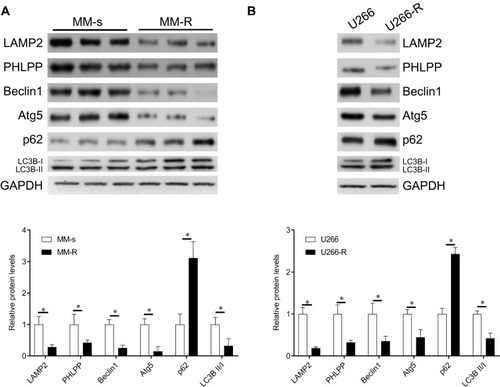
Figure 2 Overexpression of PHLPP sensitizes MM cells to BTZ. (A) Western blot analyses of PHLPP expression in U266 cells and BTZ-resistant U266 cells after lentivirus infection. (B) BrdU assays were used to determine cell viability after sh-PHLPP or PHLPP lentivirus infection in U266 and U266-R cells, respectively. (C) Flow cytometry was used to determine apoptosis after knockdown or overexpression of PHLPP under BTZ treatment. (D) U266 cells were infected with PHLPP lentivirus and were then injected into nude mice. Tumor volumes were measured weekly. (E) PHLPP and LAMP2 expression in tumor sections were evaluated using immunohistochemistry (IHC); Magnification, 100X; *P < 0.05.
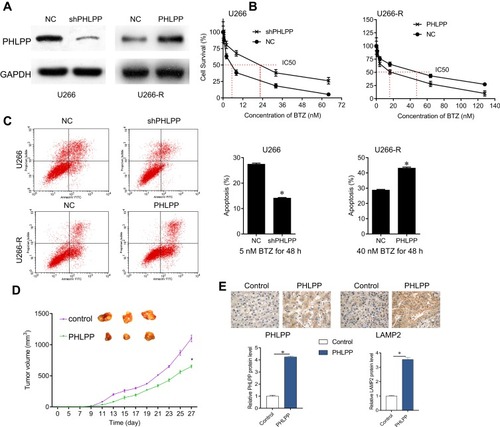
Figure 3 PHLPP positively regulates LAMP2 expression. (A) Immunofluorescence assays were performed to investigate the interactions between PHLPP and LAMP2 in U266 cells. (B) Immunoprecipitation confirmed the interactions between PHLPP and LAMP2 in U266 cells; (C) EGFP-PHLPP was expressed in U266 cells for 48 hrs and loaded with lysotracker-Red DND-99 for 30 mins at 37°C. Cells were fixed and analyzed by confocal microscopy. (D) Western blot analyses of the expression of PHLPP, LAMP2, and key autophagy signaling molecules in U266 and U266-R cells after infection with sh-PHLPP or PHLPP lentivirus. (E) Quantification of the bands in (D). *P < 0.05.
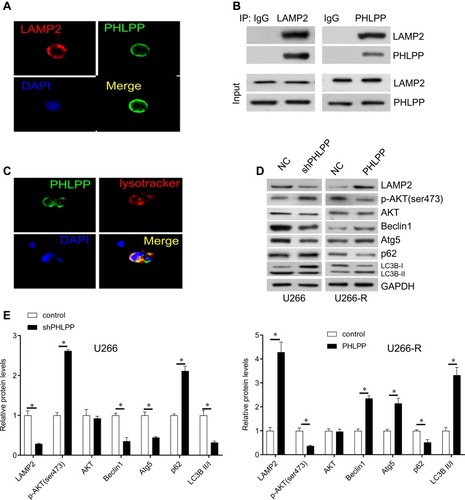
Figure 4 LAMP2 knockdown reverses the inhibitory effects of PHLPP in U266-R cells. (A) Western blot analyses of the expression of PHLPP, LAMP2, and key autophagy signaling molecules in U266-R cells infected with sh-LAMP2 or PHLPP lentivirus under 40 nM BTZ treatment (left), and quantification of the bands (right). (B) Western blot analyses of the expression of PHLPP, LAMP2, and key autophagy signaling molecules in U266 cells that were infected with LAMP2 or shPHLPP lentivirus under 5 nM BTZ treatment (left), and quantification of the bands (right). (C) Cell proliferation was evaluated using BrdU assay in U266-R cells that were infected with sh-LAMP2 or PHLPP lentivirus under 40 nM BTZ treatment. (D) Apoptosis was evaluated using flow cytometry in U266-R cells that were infected with sh-LAMP2 or PHLPP lentivirus under 40 nM BTZ treatment. (E) Cell proliferation was evaluated using BrdU assay in U266 cells that were infected with LAMP2 or shPHLPP lentivirus under 5 nM BTZ treatment. (F) Apoptosis was evaluated using flow cytometry in U266 cells that were infected with LAMP2 or shPHLPP lentivirus under 5 nM BTZ treatment. *P < 0.05.
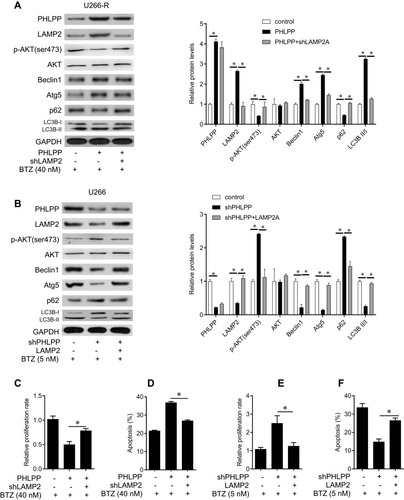
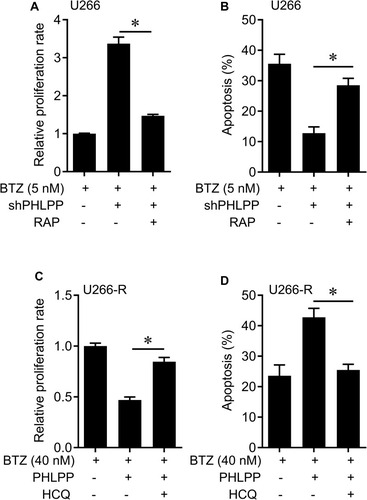
Figure 5 The effects of pharmacological inhibitor of autophagy on PHLPP-mediated cell apoptosis. (A) Cell proliferation was evaluated using BrdU assay in U266 cells that were infected with shPHLPP lentivirus and treated with rapamycin (RAP) under 5 nM BTZ treatment. (B) Apoptosis was evaluated using flow cytometry in U266 cells that were infected with shPHLPP lentivirus and treated with rapamycin (RAP) under 5 nM BTZ treatment. (C) Cell proliferation was evaluated using BrdU assay in U266-R cells that were infected with PHLPP lentivirus and treated with hydroxychloroquine (HCQ, 25 μM) under 40 nM BTZ treatment. (D) Apoptosis was evaluated using flow cytometry in U266-R cells that were infected with PHLPP lentivirus and treated with hydroxychloroquine (HCQ, 25 μM) under 40 nM BTZ treatment. *P < 0.05.