Figures & data
Figure 1 Expression of EZH2 in GC cell lines. (A, B) Quantitative PCR (A) and Western blotting (B) were used to examine EZH2 expression in GC cell lines (MGC-803, AGS, and SGC-7901) and the gastric epithelial cell line, GES-1. GAPDH served as an internal control. *p < 0.05, **p < 0.01, as compared with GES-1 cells.
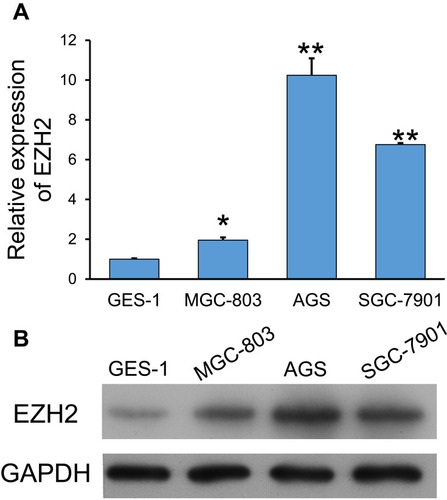
Figure 2 Concentration-dependent anti-proliferative effect of diosgenin on AGS and SGC-7901 cells. (A) CCK-8 assays were performed to evaluate the effect of different concentrations of diosgenin on the proliferation of AGS and SGC-7901 cells. (B, C) The IC50 values of AGS and SGC-7901 to GSK126 (B) and diosgenin (C) were calculated measured by using CCK8 kit assay , respectively.
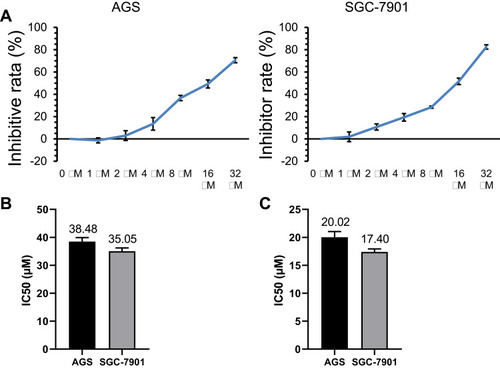
Figure 3 A combination of diosgenin and GSK126 produced a synergistic effect on GC cell proliferation. CCK-8 assays were performed to evaluate the proliferation of (A) AGS and (B) SGC-7901 cells after treatment with either diosgenin or GSK126 alone, or in combination. *p < 0.05, **p < 0.01, as compared with control cells.
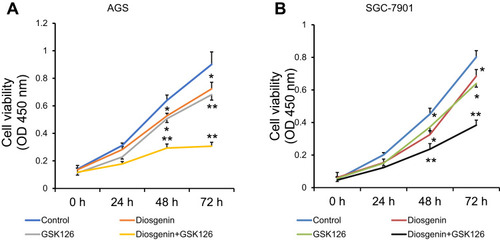
Figure 4 The effects of combined treatment with diosgenin and GSK126 on cell cycle progression and apoptosis in GC cells. AGS and SGC-7901 cells were treated with diosgenin or GSK126 alone, or in combination, respectively. (A) Flow cytometry with PI staining was used to detect the cell cycle distribution of AGS and SGC-7901 cells. (B) Flow cytometry with Annexin V/PI double staining was used to detect the cell cycle distribution of AGS and SGC-7901 cells. *p < 0.05, **p < 0.01, ***p < 0.001, as compared with control; #p < 0.05, as compared with diosgenin or GSK126 treatment.
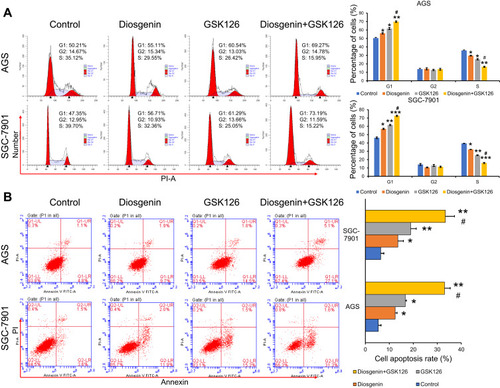
Figure 5 The effects of combined treatment with diosgenin and GSK126 on the migration and invasion of GC cells. AGS and SGC-7901 cells were treated with diosgenin or GSK126 alone, or in combination, respectively. Transwell assays were performed to evaluate the migration and invasion capabilities of (A) AGS and (B) SGC-7901 cells. *p < 0.05, **p < 0.01, as compared with control; #p < 0.05, as compared with diosgenin or GSK126 treatment.
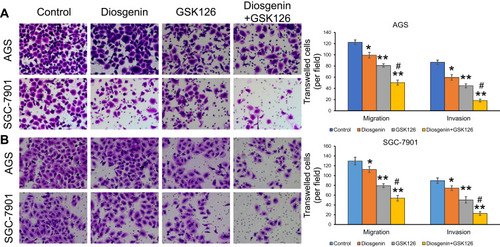
Figure 6 The effects of combined treatment with diosgenin and GSK126 on Rho/ROCK signaling and the epithelial–mesenchymal transition. AGS and SGC-7901 cells were treated with diosgenin or GSK126 alone, or in combination, respectively. (A) Western blot assays were performed to detect the expression of EZH2, RhoA, and ROCK in AGS cells. (B) The levels of E-cadherin, N-cadherin, vimentin, and fibronectin expression in AGS cells were measured by Western blotting *p < 0.05, **p < 0.01, as compared with control; #p < 0.05, as compared with diosgenin or GSK126 treatment.
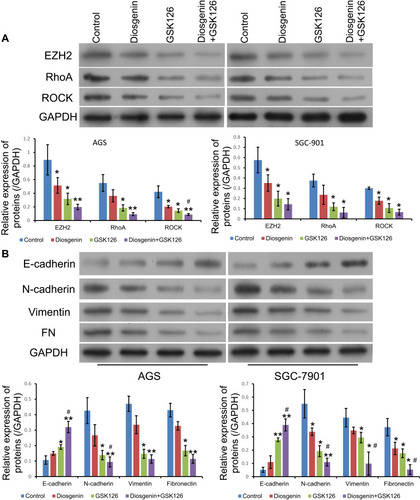
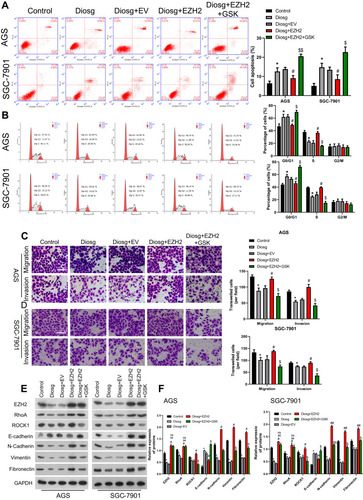
Figure 7 Diosgenin inhibited malignant biological properties through EZH2/RhoA pathway. (A, B) Flow cytometry with PI staining was used to detect the cell cycle distribution of AGS (A) and SGC-7901 (B). (C, D) Transwell assays were performed to evaluate the migration and invasion capabilities of (C) AGS and (D) SGC-7901 cells. (E, F) Western blot assay was used to measure EZH2, RhoA/ROCK1 and EMT related proteins. *p<0.05 vs control; #p<0.05, ##p<0.01 vs diosgenin; $p<0.05, $$p<0.01 vs diosgenin+EZH2.