Figures & data
Figure 1 PKM2 affected the proliferation and mobility of HCC cells via regulating ODC1. (A) Western blotting was used to detect the expression of PKM2 and ODC1 in HepG2 and SMMC-7721 cells after downregulating PKM2 using two siRNAs (si1-PKM2 and si2-PKM2). (B) CCK-8 assays were performed to detect the proliferation of the cells with downregulated PKM2. (C) Transwell assays were performed to detect the invasion of the cells with downregulated PKM2. (D) Western blotting was used to detect the expression of PKM2 and ODC1 in four groups of cells transfected with: 1. NC plasmid plus scramble siRNA; 2. NC plasmid plus siRNA targeting PKM2; 3. ODC1 overexpression plasmid plus scramble siRNA; 4. ODC1 overexpression plasmid plus siRNA targeting PKM2. (E) CCK-8 assays were used to detect the effects of ODC1 overexpression on the proliferation of the cells with downregulated PKM2. (F) Transwell assays were used to detect the effects of ODC1 overexpression on the invasion of the cells with downregulated PKM2. *, P<0.05; **, P<0.01.
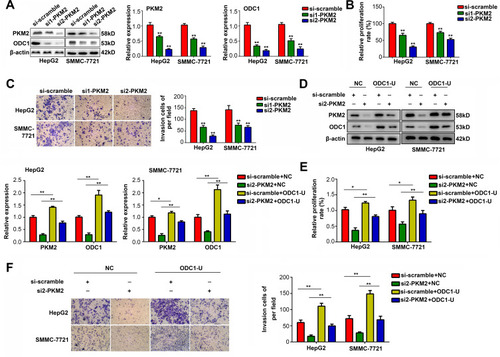
Figure 2 ODC1 regulated the c-myc-induced PKM2 transcription modulation via upregulating polyamines in HCC cells. (A) Western blotting was performed to detect the protein expression level of PKM2 and ODC1 when ODC1 was overexpressed or suppressed in HCC cells. (B) qRT-PCR was performed to detect the mRNA expression level of PKM2 and ODC1 when ODC1 was overexpressed or suppressed in HCC cells. (C) Western blotting was performed to detect the protein expression level of c-myc when ODC1 was overexpressed or suppressed in HCC cells. (D) Western blotting was used to detect the expression of PKM2, ODC1 and c-myc in four groups of cells transfected with: 1. NC plasmid plus scramble siRNA; 2. ODC1 overexpression plasmid plus scramble siRNA; 3. NC plasmid plus siRNA targeting c-myc; 4. ODC1 overexpression plasmid plus siRNA targeting c-myc. (E) Western blotting was used to detect the effect of spermidine and spermine on the expression of c-myc. (F) Immunofluorescence was used to detect the effect of spermidine and spermine on the nuclear localization of c-myc. *, P<0.05; **, P<0.01.
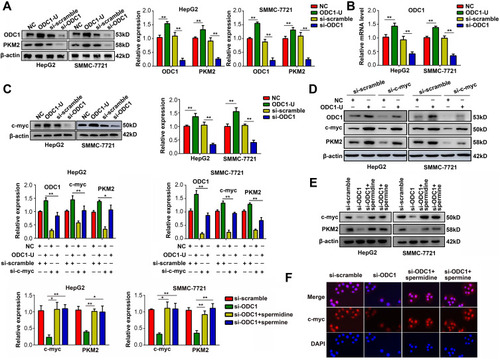
Figure 3 PKM2 was co-expressed with ODC1 in HCC tissues. (A) ODC1 and (B) PKM2 expression in HCC and adjacent tissues and (C) co-expression relationship between ODC1 and PKM2 in TCGA samples. (D) ODC1 and (E) PKM2 expression detected using qRT-PCR in our samples (n=32) and (F) co-expression relationship between ODC1 and PKM2 based on qRT-PCR (G) and immunohistochemical staining. (H) Kaplan–Meier survival analysis of four groups in the TCGA database according to PKM2 and ODC1 expression (H+H: both high ODC1 and PKM2 expression; L+H: only high PKM2 expression; H+L: only high ODC1 expression; L+L: both low ODC1 and PKM2 expression). *, P<0.05; **, P<0.01.
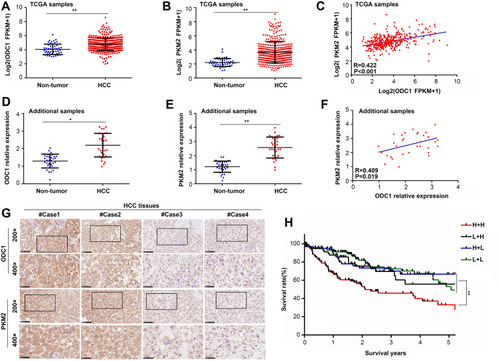
Figure 4 ODC1 inhibitor DFMO and PKM2 inhibitor compound 3k exert synergistic effects on HCC cell proliferation and apoptosis in vitro. (A) Chemical formulae of DFMO and compound 3k. (B) ODC1 and PKM2 expression in HCC cells treated with control (DMSO), compound 3k (2.5 μM), DFMO (500 μM), and the combination was detected using Western blotting. (C) PKM2 activity in the four groups of HCC cells was determined using a Pyruvate Kinase Assay Kit. (D-E) CCK-8 assays were used to assess the proliferation rate in the four groups of HCC cells at 24 and 48 h. The CI index was also calculated. (F-G) Flow cytometry was used to determine the apoptosis rate at 24 and 48 h in the four groups of HCC cells. *, P<0.05; **, P<0.01.
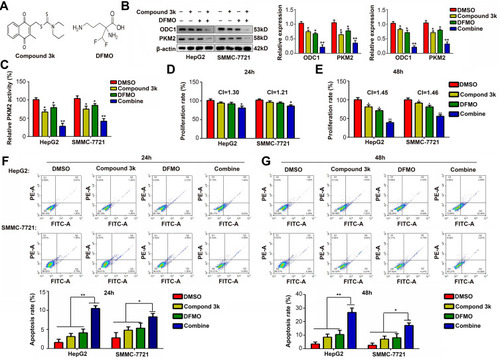
Figure 5 ODC1 inhibitor DFMO and PKM2 inhibitor compound 3k exert synergistic effects on cell mobility and EMT phenotype in vitro. (A-B) Wound healing assays were used to assess the migration rate at 24 h of HCC cells treated with control (DMSO), compound 3k (2.5 μM), DFMO (500 μM), or the combination. (C-D) Transwell assays were used to detect the invasion rate at 24 h in the four groups of HCC cells. (E-G) Western blotting was used to detect the expression of E-cadherin and vimentin in the four groups of HCC cells. **, P<0.01.
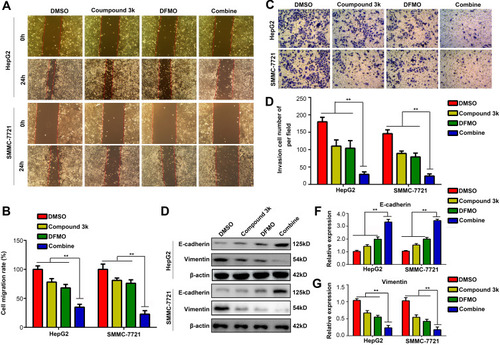
Figure 6 ODC1 inhibitor DFMO and PKM2 inhibitor compound 3k exert synergistic effects on HCC proliferation in vivo. (A) Proliferation rate of HCC tumor treated with control (DMSO), compound 3k, DFMO, and the combination was detected. (B) Size of HCC tumor in the four groups. (C) Weight of HCC tumor in the four groups. (D) The expression of PKM2, ODC1, PCNA, and KI67 in HCC tissues was detected using immunohistochemical staining (200×). (E) Effects of the four treatments on the liver, kidney, and heart in mice were detected using HE staining (200×). *, P<0.05; **, P<0.01.
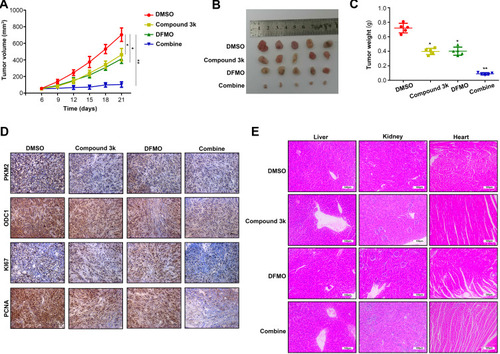
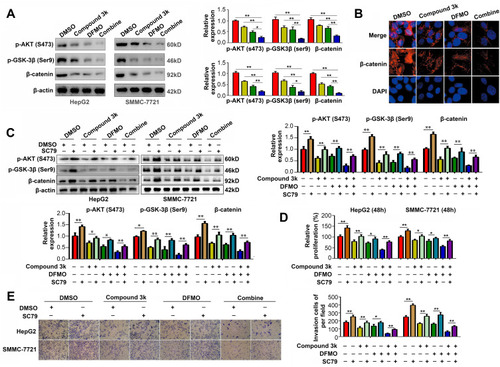
Figure 7 ODC1 inhibitor DFMO and PKM2 inhibitor compound 3k exert synergistic effects on the AKT/GSK-3β/β-catenin pathway. (A) Western blotting was used to detect the expression of p-AKT (Ser473), p-GSK-3β (Ser9), and β-catenin in HCC cells treated with control (DMSO), compound 3k (2.5 μM), DFMO (500 μM), and the combination. (B) Immunofluorescence was used to detect the location of β-catenin in the four groups of HepG2 cells. (C) Western blotting demonstrated that the AKT activator SC79 reversed the effects of the four treatments on the AKT/GSK-3β/β-catenin pathway. (D) CCK-8 assays demonstrated that the AKT activator SC79 reversed the effects of the four treatments on HCC cell proliferation. (E) Transwell assays demonstrated that the AKT activator SC79 reversed the effects of the four treatments on the HCC cell invasion. *P<0.05; **P<0.01.