Figures & data
Figure 1 MiR-483 expression level in glioma tissues and cell lines (A) MiR-483 expression was significantly lower in tumor tissue samples than that of paracancerous tissues. (B) Kaplan–Meier analysis indicated that glioma patients with lower miR-483 level had a worse overall survival. (C) MiR-483 was generally up-regulated in HEB cells compared with LN18 and LN229 (*P<0.05, **P<0.01).
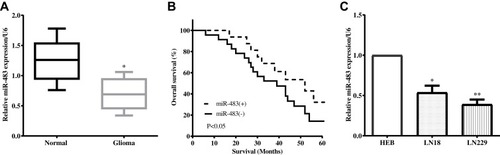
Figure 2 MiR-483 inhibited LN229 cell migration, invasion. (A) MiR-483 mimic significantly increased miR-483 expression in LN229 cells. (B) The migration and invasion were calculated after transfecting miR-483 mimic in LN229 cells. (C) The expression of miR-483 was downregulated after transfected miR-483 inhibitor. (D) Cell migration and invasion were enhanced by miR-483 inhibitor compared to the negative control (*P<0.05, **P<0.01).
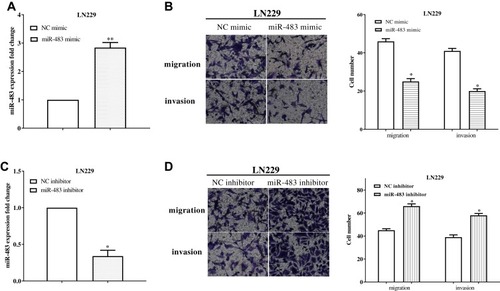
Figure 3 MiR-483 promoted LN229 cell apoptosis in vitro. (A–C) The expression of Bcl-2, Bax and caspase-3 of was evaluated after transfected miR-483 mimic. (D) Western blot was used to measure the protein level of Bcl-2, Bax and caspase-3. (E–G) The alteration of Bcl-2, Bax and caspase-3 was assessed after transfected miR-483 inhibitor. (H) Protein level of Bcl-2, Bax and caspase-3 expression in LN229 cells was evaluated by miR-483 inhibitor (*P<0.05).
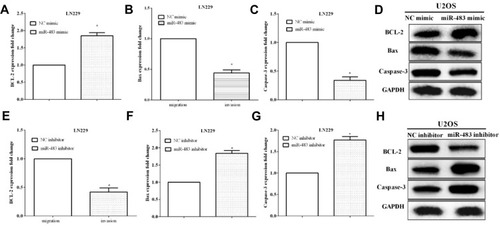
Figure 4 SOX3 was a predicted target of miR-483 in LN229 cells. (A) SOX3 as predicted to be a potential target gene by TargetScan. (B) The Luciferase assay indicated that the luciferase activity of cells co-transfected with wild type SOX3 and miR-483 mimic was reduced. (C) RT-qPCR was used to evaluate the SOX3 expression after altering miR-483. (D) Western blotting was employed to measure the expression of SOX3 after altering miR-483 in LN229 cells (*P<0.05).
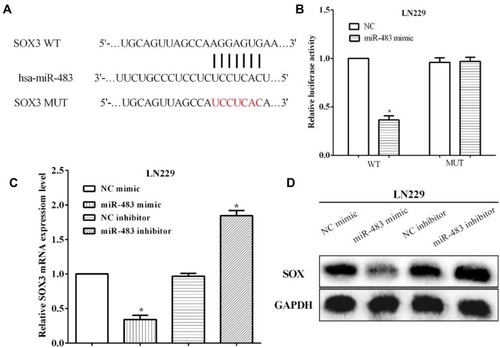
Figure 5 The expression of SOX3 in glioma tissues and cell lines. (A) The expression level of SOX3 in glioma was significantly higher compared with the normal tissues. (B) Upregulation of SOX3 predicted poor outcome. (C) SOX3 expression was higher in glioma cell lines LN18 and LN229 than normal cell line HEB. (D) The expression of miR-483 had a negative correlation with SOX3 expression (*P<0.05, **P<0.01).
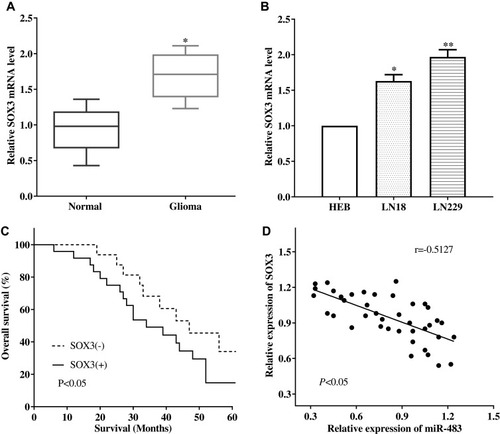
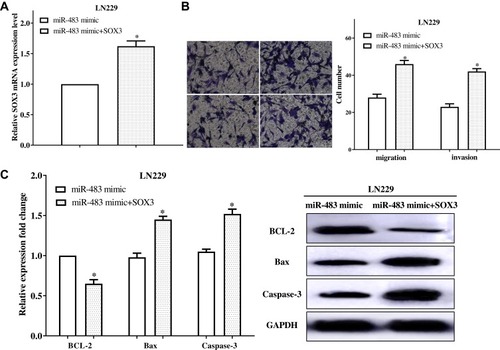
Figure 6 Elevated expression of SOX3 reversed the inhibitory effect of migration and invasion of LN229 cells by miR-483 mimic. (A) The expression of SOX3 was calculated after co-transfected with miR-483 mimic and SOX3. (B) Upregulation of SOX3 significantly partially recovered the impaired effects of miR-483 mimic on the migratory ability in LN229 cells. (C) Cell apoptosis ability was inhibited after co-transfection with miR-483 and SOX3 (*P<0.05).