Figures & data
Figure 1 Resistance of HT29/R and SW480/R to oxaliplatin. (A) Differences of oxaliplatin sensitivity between HT29/R and SW480 cells and their parental HT29 and SW480 cells. (B) Differences of oxaliplatin IC50 between HT29/R and SW480 cells and their parental HT29 and SW480 cells.
Notes: Data were expressed as mean±SD. *P<0.05.
Abbreviation: IC50, half-maximal inhibitory concentration.
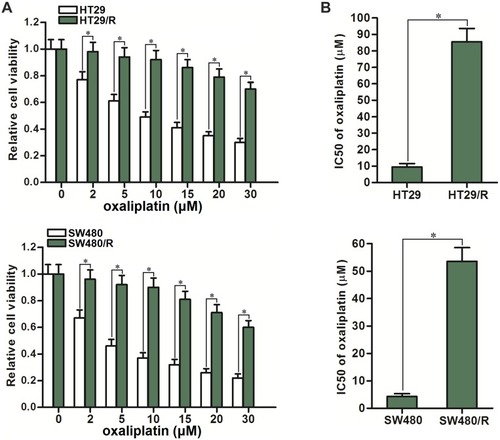
Figure 2 Differences of OCR between HT29/R and SW480/R cells and their parental HT29 and SW480 cells. (A) Differences of glucose consumption between HT29/R and SW480/R cells and their parental HT29 and SW480 cells. (B) Differences of lactate production between HT29/R and SW480/R cells and their parental HT29 and SW480 cells. (C) Differences of LDH activity between HT29/R and SW480/R cells and their parental HT29 and SW480 cells. (D) Differences of OCR between HT29/R and SW480/R cells and their parental HT29 and SW480 cells.
Notes: Data were expressed as mean±SD. *P<0.05 vs HT29, #P<0.05 vs SW480.
Abbreviations: OCR, glycolysis and oxygen consumption rate; LDH, dehydrogenase.
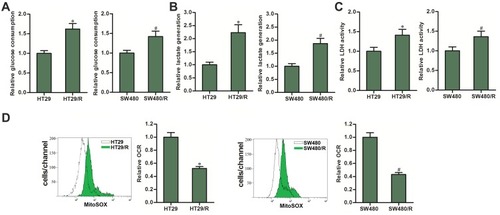
Figure 3 PDK1 partially determined the oxaliplatin sensitivity of CRC. (A) HT29/R and SW480/R cells expressed higher level of PDK1 compared to the HT29 and SW480 cells. (B) Transfection with plasmid-PDK1 increased the expression of PDK1 in HT29 and SW480 cells. (C) Transfection with plasmid-PDK1 decreased the cytotoxicity of oxaliplatin (10 μM) against HT29 and SW480 cells. (D) Transfection with plasmid-PDK1 increased the IC50 of oxaliplatin to HT29 and SW480 cells. (E) Transfection with siRNA-PDK1 decreased the expression of PDK1 in HT29/R and SW480/R cells. (F) Transfection with siRNA-PDK1 increased the cytotoxicity of oxaliplatin (10 μM) against HT29/R and SW480/R cells. (G) Transfection with siRNA-PDK1 decreased the IC50 of oxaliplatin to HT29/R and SW480/R cells.
Notes: Data were expressed as mean±SD. #P<0.05 vs oxaliplatin+plasmid-empty, &P<0.05 vs oxaliplatin+siRNA-control, *P<0.05.
Abbreviations: CRC, colorectal cancer; LDH, dehydrogenase; IC50, half maximal inhibitory concentration; siRNA, small interfering RNA; PDK1, pyruvate dehydrogenase kinase 1.
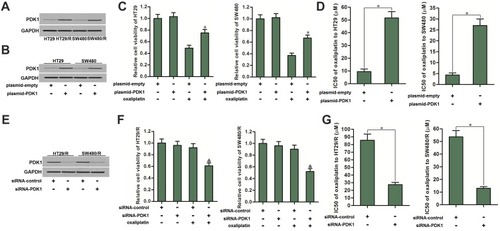
Figure 4 PDK1 was the target of miR-138 in HT29/R and SW480/R. (A) PDK1 mRNA 3ʹ UTR exits potential binding site paired with miR-138. (B) Significant downregulation of miR-138 in HT29/R and SW480/R compared to their parental cells. (C) Effect of miR-138 on inhibiting the expression of PDK1 in HT29/R and SW480/R cells. (D) Co-transfection with miR-138 decreased the luciferase activities of the pGL3 reporters contained wild type PDK1 3ʹ-UTR but not the mutant one.
Notes: Data were expressed as mean±SD. *P<0.05.
Abbreviation: PDK1, pyruvate dehydrogenase kinase 1.
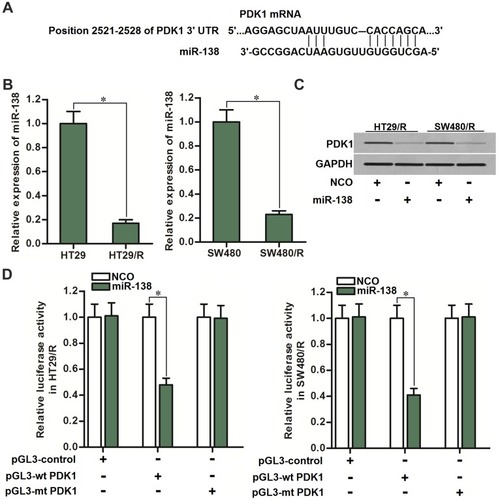
Figure 5 MiR-138 and siRNA-PDK1 failed to change the glycolysis level of HT29/R and SW480/R. (A) MiR-138 and siRNA-PDK1 exhibited no activity on glucose consumption of HT29/R and SW480/R cells. (B) MiR-138 and siRNA-PDK1 failed to change the lactate generation in HT29/R and SW480/R cells. (C) MiR-138 and siRNA-PDK1 failed to change the LDH activity in HT29/R and SW480/R cells.
Note: Data were expressed as mean±SD.
Abbreviations: LDH, dehydrogenase; siRNA, small interfering RNA; PDK1, pyruvate dehydrogenase kinase 1.
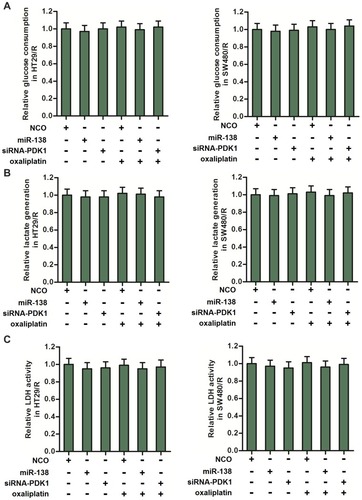
Figure 6 MiR-138 increased the OCR and decreased the oxaliplatin resistance of HT29/R and SW480/R through suppression of PDK1. (A) MiR-138 and siRNA-PDK1 significantly increased the OCR of HT29/R and SW480/R cells. (B) Transfection with plasmid-PDK1 inhibited the effect of miR-138 on increasing the OCR in oxaliplatin-treated (10 μM) HT29/R and SW480/R cells. (C) Transfection with plasmid-PDK1 decreased the sensitization of miR-138 on oxaliplatin-induced (10 μM) cytotoxicity against HT29/R and SW480/R cells. (D) Transfection with plasmid-PDK1 decreased the IC50 of oxaliplatin to HT29/R and SW480/R cells.
Notes: Data were expressed as mean±SD. *P<0.05 vs NCO group, #P<0.05 vs oxaliplatin+NCO group, &P<0.05 vs oxaliplatin+miR-138 group.
Abbreviations: OCR, glycolysis and oxygen consumption rate; IC50, half-maximal inhibitory concentration; siRNA, small interfering RNA; PDK1, pyruvate dehydrogenase kinase 1; NCO, negative control oligonucleotides.
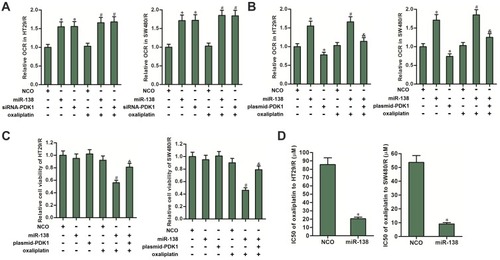
Figure 7 MiR-138 promoted generation of ROS in oxaliplatin-treated HT29/R and SW480/R cells. (A) MiR-138 enhanced the effect of oxaliplatin (10 μM) on producing the ROS in HT29/R and SW480/R cells. (B) NAC (2 mM) decreased the sensitization of miR-138 on oxaliplatin-induced (10 μM) cytotoxicity against HT29/R and SW480/R cells.
Notes: Data were expressed as mean±SD. #P<0.05 vs oxaliplatin+NCO group, &P<0.05 vs oxaliplatin+miR-138 group.
Abbreviations: NCO, negative control oligonucleotides; ROS, reactive oxygen species; NAC, N-acetylcysteine.
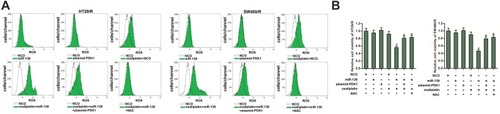
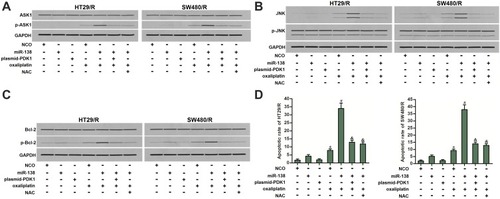
Figure 8 ASK1/JNK/Bcl-2 pathway in miR-138 and oxaliplatin co-treated HT29/R and SW480/R cells. (A) MiR-138 enhanced the phosphorylation of ASK1 in oxaliplatin-treated (10 μM) HT29/R and SW480/R cells, whereas plasmid-PDK1 or NAC (2 mM) inhibited the ASK1 phosphorylation. (B) Effect of miR-138, plasmid-PDK1, oxaliplatin (10 μM) and NAC (2 mM) on changing the phosphorylation of JNK in HT29/R and SW480/R cells. (C) Effect of miR-138, plasmid-PDK1, oxaliplatin (10 μM) and NAC (2 mM) on changing the phosphorylation of Bcl-2 in HT29/R and SW480/R cells. (D) miR-138 enhanced oxaliplatin-induced (10 μM) apoptosis of HT29/R and SW480/R cells, whereas plasmid-PDK1 or NAC (2 mM) decreased the apoptotic rate of them.
Notes: Data were expressed as mean±SD. *P<0.05 vs NCO group, #P<0.05 vs oxaliplatin+NCO group, &P<0.05 vs oxaliplatin+miR-138 group.
Abbreviations: NCO, negative control oligonucleotides; NAC, N-acetylcysteine; PDK1, pyruvate dehydrogenase kinase 1; ASK1, apoptosis signal-regulating kinase 1; JNK, c-Jun N-terminal kinase; Bcl-2, B-cell lymphoma-2.