Figures & data
Figure 1 Depletion of HK2 decreased tumorigenic properties of aerobic glycolytic non-small cell lung cancer (NSCLC) cells. (A and B) 2-DG uptake (A) and lactate production (B) in various NSCLC cells and immortalized lung epithelial cells. (C) HK2 expression in NSCLC cells and immortalized lung epithelial cells were analyzed by immunoblotting L.E: Long exposure; S.E, short exposure. (D) immunohistochemistry (IHC) analysis of HK2 expression in NSCLC tissue array. (E) Cell viability of HK2 knockout and control H460 (left) and HCC827 (right) stable cells were analyzed by MTS assay. The IB data showed the HK2 protein levels in sgCtrl and sgHK2 cells. (F) Anchorage-independent cell growth of HK2 knockout and control H460 (top) and HCC827 (bottom) cells. (G-I) Average tumor volume (G), photographed tumor mass (H), and average tumor weight (I) of HCC827 sgCtrl and sgHK2 xenograft tumors. ***p<0.001.
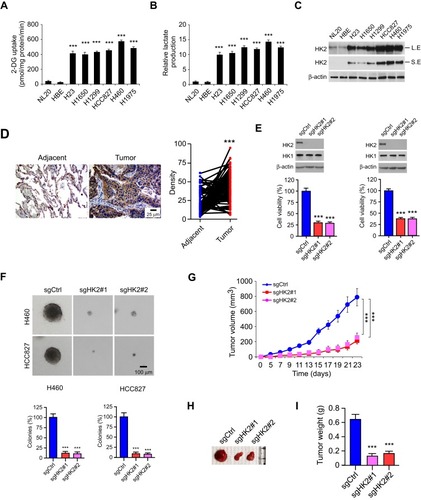
Figure 2 Sinomenine inhibits HK2-mediated glycolysis in aerobic glycolytic NSCLC cells. (A) The structure of sinomenine. (B) pH value of cell culture medium form sinomenine-treated NSCLC cells. (C) qRT-PCR analysis of the glycolysis-related genes with 100 μM sinomenine treatment in HCC827 cells. (D-F) sinomenine inhibited HK2 expression (left), and reduced glucose uptake (middle) and lactate production (right) in HCC827 (D), H1975 (E), and H460 (F) cells. SIN, sinomenine. *p<0.05, ***p<0.001.
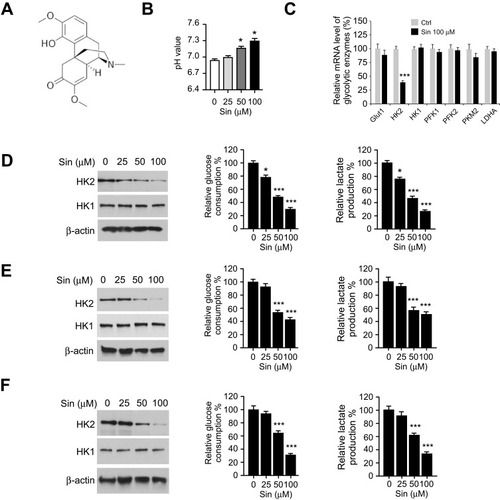
Figure 3 Sinomenine inhibits cell growth and colony formation of NSCLC cells. (A) MTS assay analysis of the cell viability of HBE and NL20 cells treated with sinomenine for 72 h. (B-D) MTS assay analysis of the cell viability of HCC827 (B), H1975 (C), and H460 (D) cells treated with sinomenine with different doses and time points. (E-G) the effects of sinomenine on colony formation of HCC827 (E), H1975 (F), and H460 (G) cells. (H) Immunofluorescence (IF) analysis of Histone H3 Ser 10 phosphorylation in sinomenine-treated HCC827 cells. **p<0.01, ***p<0.001.
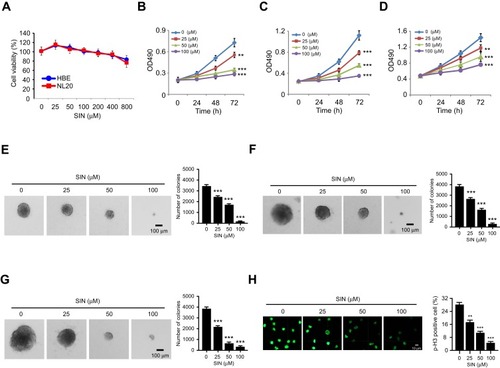
Figure 4 Overexpression of HK2 reduces sinomenine-induced mitochondrial apoptosis in NSCLC cells. (A and B) HCC827, H1975, and H460 cells were pre-treated with z-VAD-fmk, necrostatin-1, or GSK’873 for 4 h, followed by sinomenine treated for 72 h, cell viability was determined by MTS (A) and trypan blue exclusion assay (B). (C) Caspase 3 activity in sinomenine-treated NSCLC cells. (D) The expression of cleaved-caspase 3 and -PARP in sinomenine-treated NSCLC cells was analyzed by IB. (E) Cleaved-caspase 3 in sinomenine-treated HCC827 cells was determined by IF analysis. (F) The expression of cytochrome c and Bax in subcellular fractions of sinomenine-treated HCC827 cells was determined by IB analysis. Cyto, cytosolic fraction, Mito, mitochondrial fraction. (G) The expression of HK2, cytochrome c, and Bax in subcellular fractions of sinomenine-treated HCC827 cells with HK2 overexpression was determined by IB analysis. Cyto, cytosolic fraction, Mito, mitochondrial fraction. (H and I) HCC827 cells were transfected with HK2 and treated with sinomenine, cell viability was analyzed by MTS (H) and trypan blue exclusion assay (I). (J) The expression of cleaved-caspase 3 and -PARP in sinomenine-treated HCC827 cells with HK2 overexpression was examined by IB analysis. *p<0.05, **p<0.01, ***p<0.001.
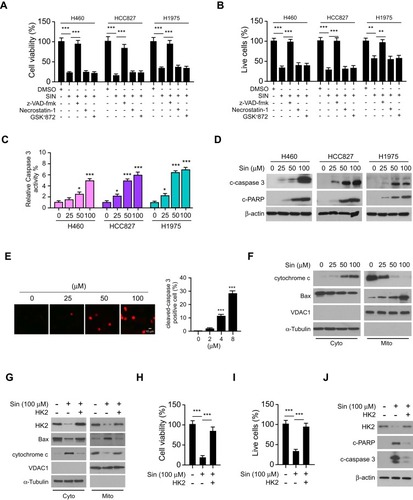
Figure 5 Inhibition of Akt activity is required for sinomenine-mediated glycolysis suppression. (A) IB analysis of Akt and S6 phosphorylation in sinomenine-treated HCC827 (left) and H1975 (right) cells. (B and C), IB analysis of Akt phosphorylation and HK2 expression in sinomenine or wortmannin treated HCC827 (B) and H1975 (C) cells. (D) IB analysis of HK2 and Akt protein levels in siCtrl and siAkt transfected HCC827 and H1975 cells. (E) Glucose uptake (left) and lactate production (right) in siCtrl and siAkt transfected HCC827 and H1975 cells. (F) IB analysis (left), glucose consumption (middle), and lactate production (right) measurement of HCC827 cells were transfected with Myr-Akt1. (G) IB analysis of cleaved-caspase 3 and PARP in HCC827 cells transfected with Myr-Akt1. (H) IF analysis of cleaved-caspase 3 in sinomenine-treated HCC827 cells with Myr-Akt1 transfection. **p<0.01, ***p<0.001.
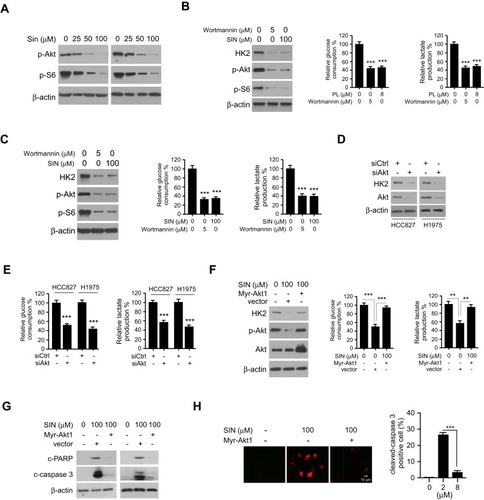
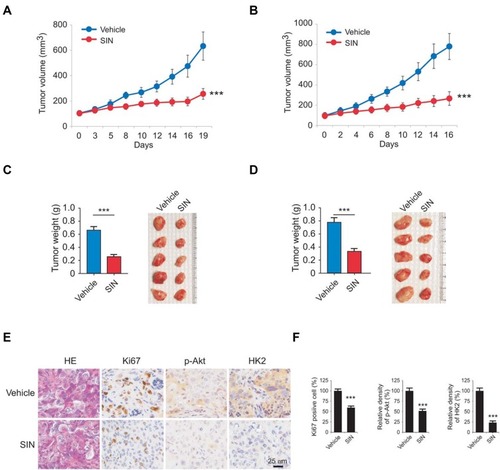
Figure 6 Sinomenine inhibits in vivo tumor growth. (A and B) The average tumor volumes derived from HCC827 (A) and H1975 (B) cells with vehicle or sinomenine treatment. (C and D) Tumor weight (left) and tumor mass (right) of HCC827 (C) and H1975 (D) xenograft tumors. (E and F) The expression of Ki67, p-Akt, and HK2 in xenograft tumors were analyzed by immunohistochemical staining (E) and qualification (F). All panels are of the same magnification. ***p<0.001.