Figures & data
Table 1 Clinicopathological Characteristics in TCGA BLCA Cohort
Figure 1 Promoter hypomethylation of MMP11 in bladder cancer. (A) Promoter hypomethylation in MMP11 gene in bladder cancer tissues. (B) Methylation status in each CpG site in MMP11 promoter in bladder cancer. (C) Compared to normal bladder tissues, a significant decrease of methylation was found at −347CpG site (cg22418565) in MMP11 promoter in bladder cancer tissues. (D) Lower methylation level was found at −347CpG site (cg22418565) in MMP11 promoter in bladder cancer tissues compared to their matched normal tissues. (E) Bisulfite sequencing assays showing hypomethylation in MMP11 promoter in bladder cancer cell T24 compared to normal bladder cell SV-HUC-1, in particular at −347CpG, −267CpG, and −66CpG sites. Upper left: MMP11 promoter sequence and CpG sites. Right: representative bisulfite sequencing results. Filled circles indicate methylated CpGs, while empty circles indicate unmethylated CpGs. Student’s t-test was performed in (A, B, C, E) (two tailed, unpaired) and (D) (two tailed, paired). Data represent means±SEM in (A, B, C, E). *P<0.05; **P<0.01; ****P<0.0001; ns, not statistically significant.
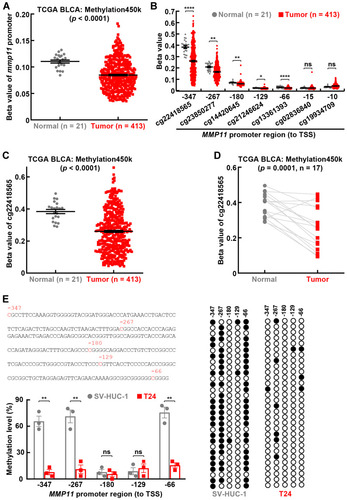
Figure 2 MMP11 is upregulated in bladder cancer in vivo and in vitro. (A, B) IHC staining in tissue microarray showing increased MMP11 protein level in bladder cancer tissues. The representative images of IHC and HE are shown in (A), while the quantification of MMP11 protein level is summarized in (B). (C) ELISA assays showing increased MMP11 protein levels in culture medium from bladder cancer cell lines T24, UMUC3, and 5637, compared to normal bladder cell SV-HUC-1. Scale bar in (A), 20 μm. Student’s t-test was performed (two-tailed, unpaired) and data represent means±SEM in (B) and (C). **P<0.01.
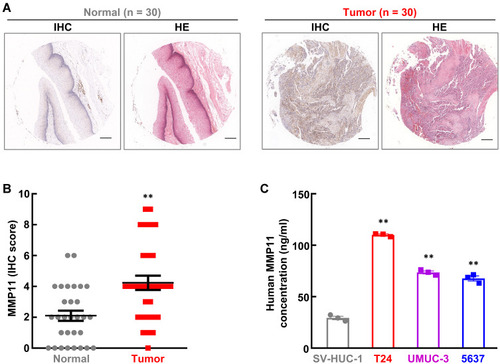
Figure 3 Big data analysis reveals MMP11 expression in bladder cancer. (A) GO term cellular component analysis of DEGs. (B) Top 10 most differentially expressed genes in yellow part in (A). (C) 14.9-fold increase of MMP11 expression was observed in bladder tumor tissues compared to adjacent normal tissues. (D) A higher upregulation of MMP11 expression (28.7-fold) is found in cancer tissues in bladder cancer patients compared to their matched normal tissues. (E) MMP11 expression level gradually increased along with tumor stage in bladder cancer. Student’s t-test was performed in (C) and (E) (two tailed, unpaired) and (D) (two tailed, paired). Data represent means±SEM in (C)and (E).
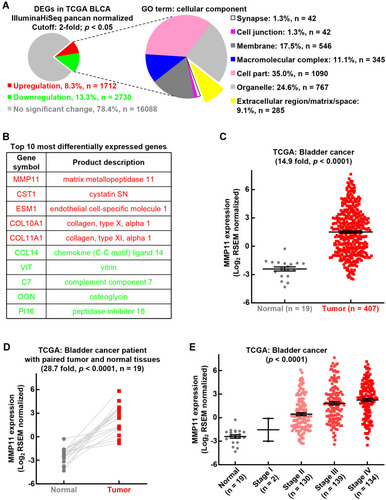
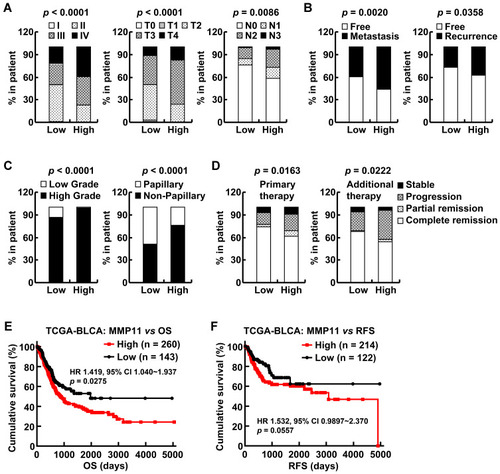
Figure 4 MMP11 overexpression is associated with tumor progression and poor patient survival in bladder cancer. MMP11 overexpression is associated with tumor progression and poor patient survival in bladder cancer. (A–C) High level of MMP11 was positively associated with advanced tumor stage, recurrence, metastasis, high disease grade, and non-papillary subtype. (D) MMP11 high expression was negatively correlated with therapy efficacy in bladder cancer. (E, F) Kaplan-Meier survival curve showing inverse association between MMP11 expression and overall survival and recurrence free survival in bladder cancer. Chi-square (χ2) test or Fisher’s exact test was performed in (A–D). Log rank test was performed in (E, F).