Figures & data
Table 1 Summary of Differentially Expressed Genes Associated with Cell–Cell Signaling (GO: 0007267) in Relation to Response to CCRT in Rectal Carcinoma
Figure 1 Analysis of gene expression in CCRT responders versus non-responders from a published transcriptomic dataset of rectal cancers (GSE35452). Clustering analysis of genes related to cell-cell signaling indicated PCSK1 is the most significantly upregulated gene in patients responsive to CCRT. Tissue specimens from responders (yellow lines) and non-responders (blue lines) are indicated on top of the heatmap, and expression levels of upregulated and downregulated genes are expressed as a spectrum of brightness of red and green, respectively, with those unaltered in mRNA.
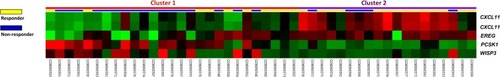
Table 2 Associations and Comparisons Between PCSK1 Expression and Clinicopathological Factors in 172 Rectal Cancer Patients Receiving Preoperative CCRT
Figure 2 Immunohistochemical staining for proprotein convertase subtilisin/kexin-type 1 (PCSK1) in rectal cancers. The non-neoplastic colonic mucosa (A) reveals no expression of PCSK1 as compared with rectal cancers with low expression (B) and high expression (C) of PCSK1 in pretreatment specimens, respectively.
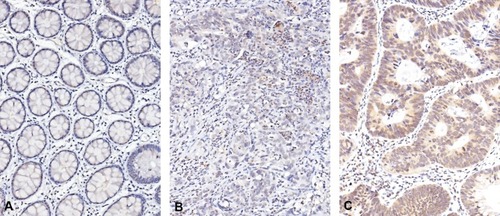
Table 3 Univariate Log-Rank Analysis for Important Clinicopathological Variables and PCSK1 Expression
Table 4 Multivariate Survival Analysis
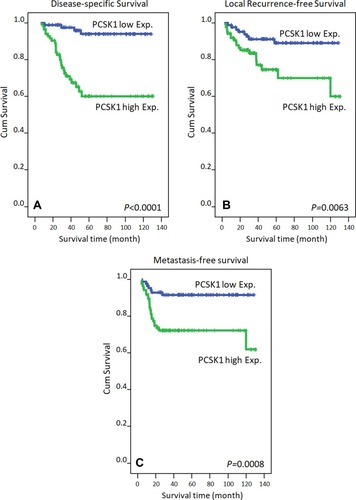
Figure 3 Kaplan–Meier survival curves plotted to predict survival. Using the Log rank test, rectal cancer patients with high expression of PCSK1 had an inferior disease-specific survival (A), local recurrence-free survival (B) and metastasis-free survival (C).