Figures & data
Table 1 Correlation of Expression of NR5A2 with Glioma Clinicopathologic Features
Figure 1 NR5A2 was highly expressed in glioma tissues and cell lines. (A) The data of NR5A2 expressions in 156 cases of glioma tumor tissues and 15 cases of adjacent nontumor tissues were harvested from TCGA database. (B) The NR5A2 mRNA expressions in 50 cases of glioma tissues and 12 cases of PTBE tissues were detected using qRT-PCR. (C) The NR5A2 expressions in different grades of glioma tissues and PTBE tissues were determined using IHC. (D) The NR5A2 expressions in different grades of glioma tissues and PTBE tissues were measured using qRT-PCR. (E) The 50 cases of glioma tissues were divided into NR5A2 high expression group and low expression group, the correlation between the survival rate of glioma patients and the expression of NR5A2 was assessed using Kaplan–Meier survival analysis. (F) The NR5A2 expression levels in human glioma cell lines (U138, U251, A172 and U87) and human normal astrocytes cell line (NHA) were analyzed using qRT-PCR. (G) The NR5A2 expression levels in human glioma cell lines (U138, U251, A172 and U87) and human normal astrocytes cell line (NHA) were evaluated using qRT-PCR. Data were shown as mean ±SD. *P<0.05 vs normal tissues or normal cell lines.
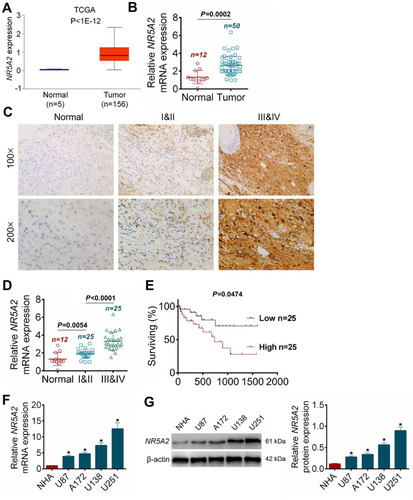
Figure 2 NR5A2 knockdown inhibited glioma cell viability and proliferation and promoted cell apoptosis. (A and B) NR5A2 expression was downregulated in U138 and U251 cells with NR5A2-sh1#/NR5A2-sh2# transfection. (C) Cell viability was detected using MTT assay. (D) Cell proliferation was measured using EdU assay (magnification: 200×). (E) Cell apoptosis was assessed using flow cytometry assay. (F) Cell cycle was analyzed using flow cytometry assay. Data were shown as mean ±SD. *P<0.05, **P<0.01 vs Scramble group.
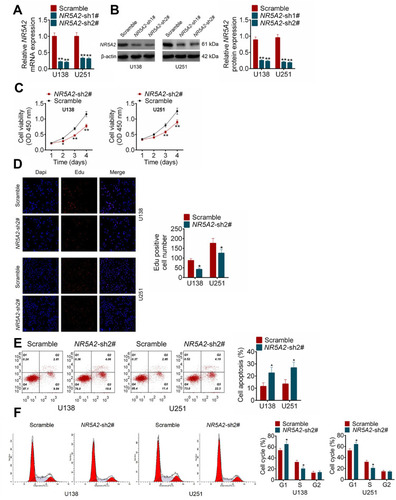
Figure 3 NR5A2 promoted cell migration and invasion in glioma cell lines (U138 and U251). (A) Cell migration was detected using wound healing assay (magnification: 200×). (B) Cell invasion was measured using transwell assay (magnification: 200×). (C) The mRNA and protein expression level of NR5A2 were respectively assessed using qRT-PCR and Western blot. (D) Cell migration was detected using wound healing assay (magnification: 200×). (E) Cell invasion was measured using transwell assay (magnification: 200×). Data were shown as mean ±SD. *P<0.05 **P<0.01 vs Scramble group or Vector group.
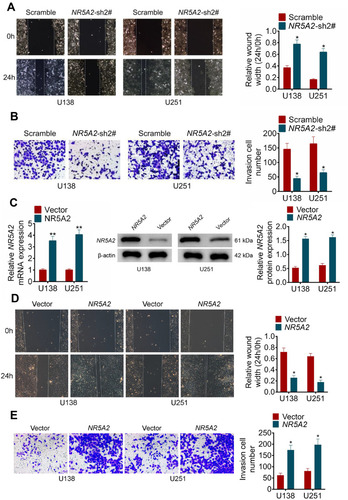
Figure 4 NR5A2 knockdown increased the sensitivity of glioma cells (U138 and U251) to TMZ. (A) Detection of IC50 by MTT to determine the effectiveness of TMZ-resistant cells. (B and C) IC50 values were detected using MTT assay. Data were shown as mean ±SD. *P<0.05, **P<0.01 vs U251 group, Vector group or Scramble group.
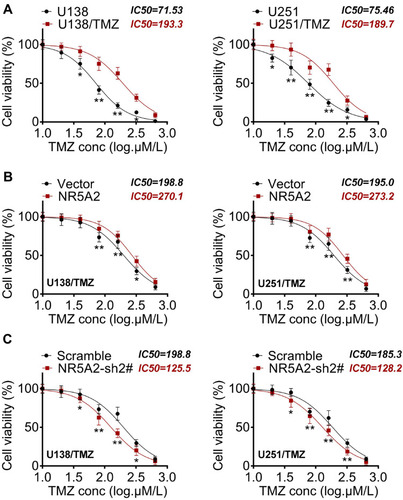
Figure 5 NR5A2 knockdown inhibited Notch signaling pathway activity. The expression levels of Notch signaling pathway-related proteins including NOTCH1, hES, Cyclin D1, p21, cleaved caspase-3, cleaved PARP, MMP2 and E-cadherin were detected using Western blot. Data were shown as mean ±SD. **P<0.01 vs Scramble group.
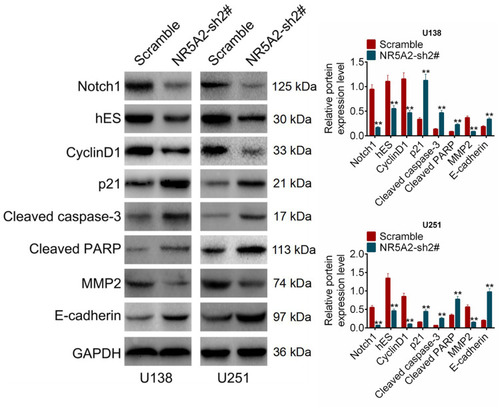
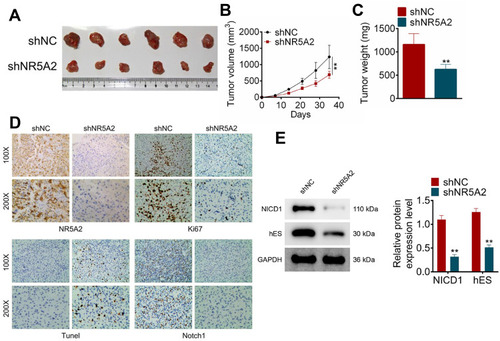
Figure 6 NR5A2 knockdown inhibited glioma tumor growth and attenuated Notch activation in vivo. (A) The pictures of the resected tumors of mice injected with U251 cells infected with shNR5A2 vectors (n = 6) and shNC (n=6), captured after 35 days. (B) The tumor volume was measured every seven days. (C) The weight of the tumor was detected immediately after resected. (D) Ki67, Notch1, NR5A2 and TUNEL expressions were determined using IHC. (E) The expression levels of Notch signaling pathway-related proteins (NICD1 and hES) were examined using Western blot. Data were shown as mean ±SD. **P<0.01 vs shNC group.