Figures & data
Figure 1 The anti-proliferative effect of PPVI in glioma cell line. (A) The structure of PPVI. U87, U251, LN229, U343 (B) and HEB (C) were treated with PPVI (0,2,4,6 and 8 µM) for 12.24 and 48 hrs. Cell viability was detected by CCK-8 assay. (D, E) The results of colony formation assays of U87 and U251cells incubated with PPVI (0,2,4 µM). ***p<0.001.
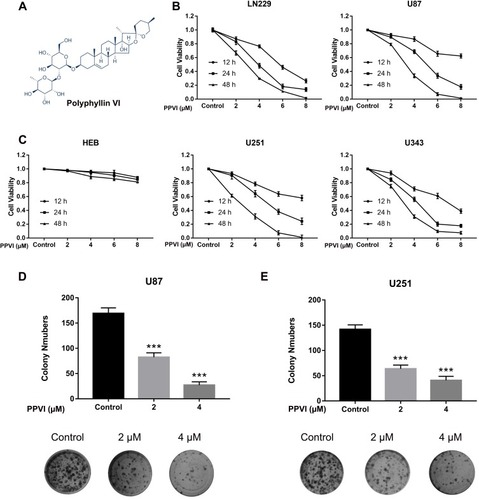
Figure 2 PPVI inhibited cell migration capacity in glioma cells. (A, B) U87 and U251 cells were incubated with PPVI (0,2,4,6 µM) and the migration capacity was evaluated by Transwell migration assays. (C) E-cadherin and N-cadherin were evaluated by Western blot. * p<0.05, *** p<0.001.
Abbreviations: Con, Control.
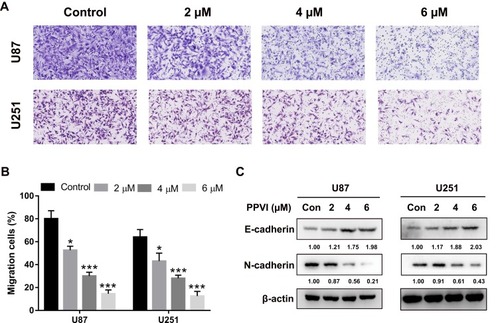
Figure 3 PPVI induced cell cycle arrest in glioma cells. (A) Cell cycle distribution was measured via flow cytometry in cells treated with the indicated concentrations of PPVI for 24 h. (B) The Cyclin B1 was detected by Western blot. * p < 0.05, ** P < 0.01, *** p < 0.001.
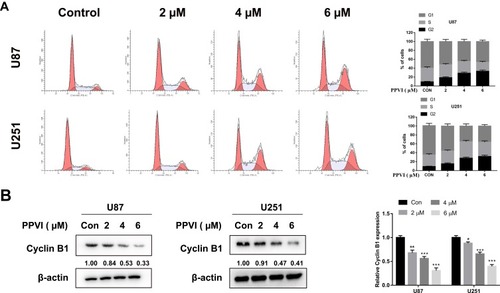
Figure 4 Apoptosis was induced by PPVI in glioma cells. Cells were treated with the indicated concentrations of PPVI for 24 hrs. (A) The apoptotic cells were detected via flow cytometry. (B) The expressions of Bcl-2, Bax and cleaved-caspase-3, −8, and −9 were analyzed by Western blot. Cells were pre-incubated with z-VAD (20 µM) for 2 hrs and then treated with PPVI (4 µM) for 24 h. (C) The CCK-8 assay was used to assess glioma cell viability. (D) Apoptotic cells were detected using flow cytometry. * p < 0.05, ** p < 0.01, ***p<0.001.
Abbreviations: z-VAD, Z-VAD-FMK; cle-cap.3, cleaved caspase-3; cle-cap.8, cleaved caspase-8; cle-cap.9, cleaved caspase-9.
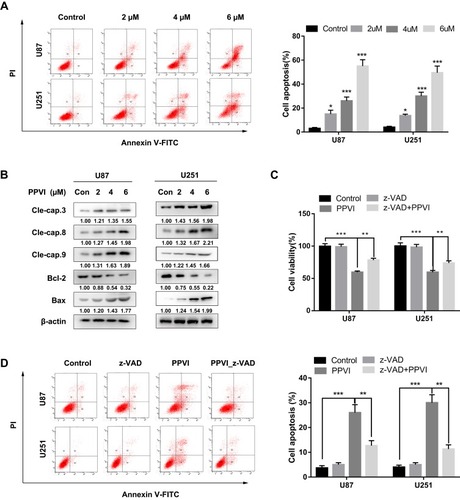
Figure 5 PPVI induced autophagy and restriction of autophagy promoted PPVI–induced apoptosis. (A) LC3 and Beclin-1 expressions were examined by Western blot analysis. Cells were pre-treated with or without 3-MA (3 mM) for 2 hrs, followed by PPVI (4 µM) treatment for an additional 24 h. (B) CCK-8 assay was used to assess glioma cell viability. (C) Apoptosis-related proteins Bax and cleaved-caspase-3 were analyzed by Western blot analysis. (D) Apoptotic cells were detected by flow cytometry. * p < 0.05, ** p < 0.01, ***p<0.001.
Abbreviations: 3-MA, 3-methyladenine.
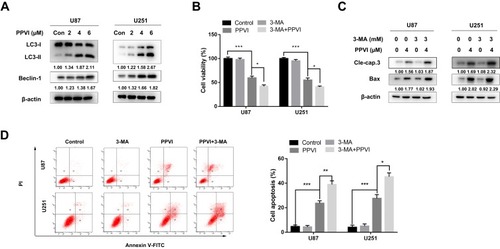
Figure 6 PPVI induced overproduction of intracellular ROS and promotes JNK and p38 phosphorylation in glioma cells. (A) Cells were treated with various concentrations of PPVI for 24 hrs and then incubated with 5 µM DCFH-DA. (B–E) Cells were pre-treated with or without NAC (10 mM) for 2 hrs followed by PPVI (4 µM) treatment for an additional 24 hrs and then stained with 5 µM DCFH-DA. The levels of ROS were detected using fluorescence microscopy and flow cytometry. The mean DCFH-DA fluorescence was shown in histograms. (F) Cells were incubated with the indicated concentrations of PPVI for 24 hrs. The expressions of p-p38, p38, p-JNK, and JNK were evaluated by Western blot analysis. * p < 0.05, ** p < 0.01, ***p<0.001.
Abbreviations: NAC, N-acetyl cysteine.
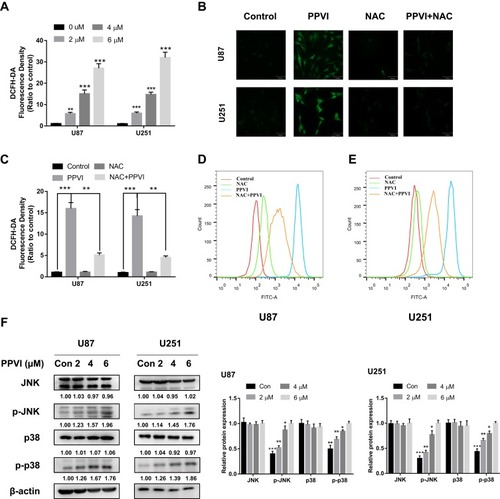
Figure 7 The JNK and p38 pathways triggered by ROS mediate PPVI-provoked cell cycle arrest, apoptosis and autophagy. (A) Apoptotic cells were measured by flow cytometry. (B) Cell cycle distribution percentages were evaluated via flow cytometry. (C) The autophagy-related proteins, apoptosis-related proteins and phospho-JNK and phospho-p38 were analyzed using Western blot. * p < 0.05, ** p < 0.01, ***p<0.001.
Abbreviations: NAC, N-acetyl cysteine; SP, SP600125; SB, SB203580.
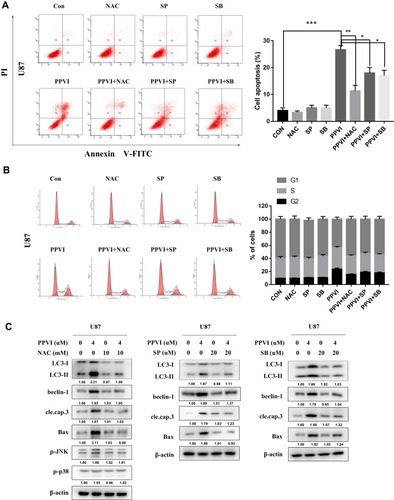
Figure 8 PPVI inhibits glioma xenograft growth in vivo. (A) Representative images of tumors harvested from nude mice. (B) Tumor volume was measured every 2 days. (C) Tumor weight was detected after mice were euthanized (D) Body weights were measured every 2 days. (E) H&E staining was used to evaluate the histology of tumor sections and immunohistochemical analysis was employed to detect the expression of Ki67. *** p < 0.001 versus the control group.
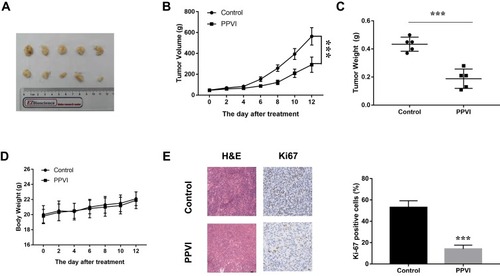
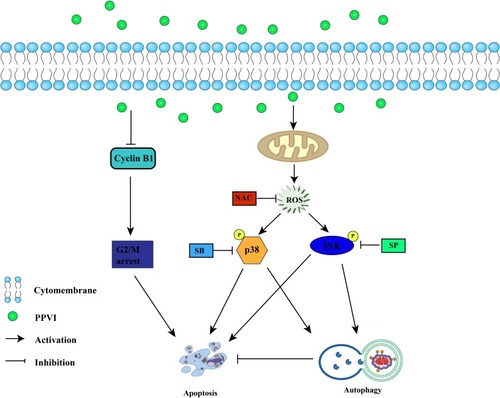
Figure 9 Hypothetical schema of PPVI–induced apoptosis and autophagy in glioma cells.