Figures & data
Figure 1 Circ_0001023 is highly expressed in GC tissues and cells. (A) The expressions of circ_0001023 in 33 cases of GC and adjacent tissues were detected by qRT-PCR. (B) The expressions of circ_0001023 in normal gastric mucosa cells (GES-1 cells) and five kinds of GC cells (AGS, BGC-823, MGC-803, MKN-28, and SGC-7901 cells) were detected by qRT-PCR. ** and *** represent p<0.01 and p< 0.001, respectively.
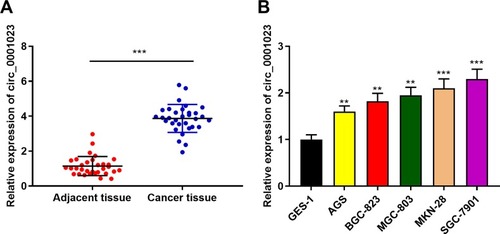
Table 1 Correlations Between Circ_0001023 Expression and Clinical Characteristics in GC Patients
Figure 2 Circ_0001023/miR-409-3p axis modulates GC cell proliferation. (A) pcDNA-circ_0001023 was transfected into AGS cells to successfully construct a cell model with over-expressed circ_0001023. MKN-28 and SGC-7901 cells were transfected with si-circ_0001023, respectively, and cell models with low-expressed circ_0001023 were successfully established. (B) The viability of GC cells was detected by CCK-8 assay. (C) The ability of colony formation of GC cells was measured by plate colony formation assay. (D) Quantification of the results of plate colony formation assay. *, **, and *** represent p<0.05, p<0.01, and p< 0.001, respectively. # represents p<0.05.
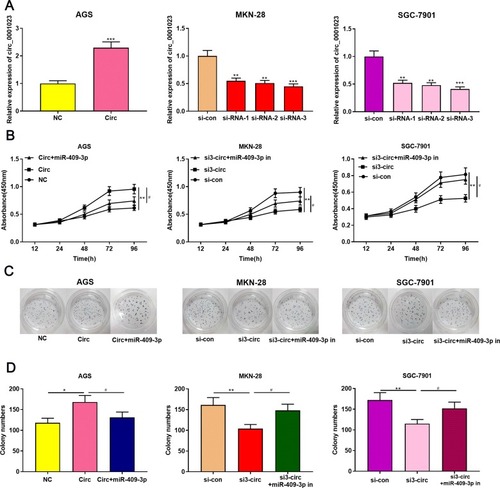
Figure 3 Circ_0001023/miR-409-3p axis regulates the metastasis of GC cells. (A) Overexpressed circ_0001023 inhibited the apoptosis of AGS cells, and this inhibitory effect was partially weakened by miR-409-3p mimics. Knock-down circ_0001023 induced apoptosis of MKN-28 and SGC-7901 cells, and miR-409-3p inhibitors partially reversed this promoting effect. (B) The expression levels of Bcl-2 and Bax were detected by Western blot. *, **, and *** represent p<0.05, p<0.01, and p< 0.001, respectively. # and ## represent p<0.05 and p<0.01, respectively.
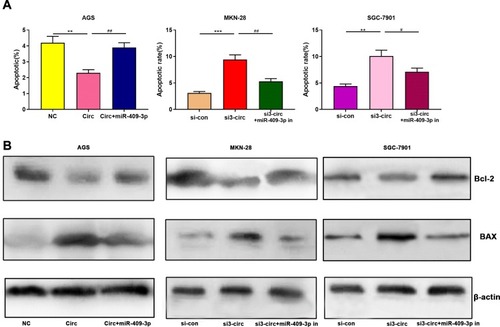
Figure 4 Circ_0001023/miR-409-3p axis regulates the apoptosis of GC cells. (A) Transwell assay confirmed that overexpressed circ_0001023 promoted the migration of AGS cells, which was partially reversed by miR-409-3p mimics. Knockdown of circ_0001023 inhibited the migration of GC cells, and miR-409-3p inhibitors partially reversed it. (B) Transwell assay validated that overexpressed circ_0001023 facilitated the invasion of AGS cells, and miR-409-3p mimics showed inhibitory effect. Knockdown of circ_0001023 can impede the invasion of GC cells, and miR-409-3p inhibitors partially weaken it. *** and *** represent p<0.05, p<0.01 and p< 0.001, respectively. # and ## represent p<0.05 and p<0.01, respectively.
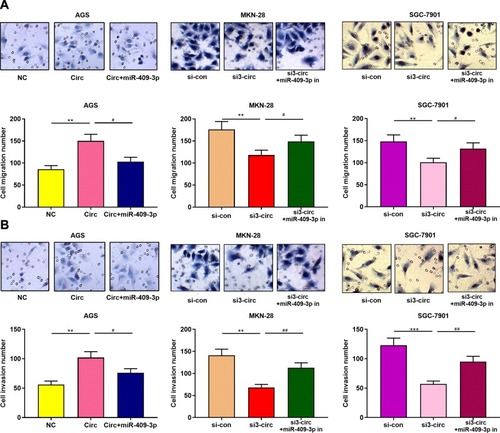
Figure 5 In GC, circ_0001023 sponges miR-409-3p and downregulates its expression level. (A) The binding site between circ_0001023 and miR-409-3p was shown. (B) qRT-PCR was performed to detect expressions of miR-409-3p in AGS cells transfected with pcDNA-circ_0001023, MKN-28, and SGC-7901 cells transfected with si-circ_0001023. (C) MiR-409-3p notably inhibited luciferase activity of wild-type circ_0001023 reporter but had no significant effect on luciferase activity of mutant type. ** and *** represent p<0.01 and p< 0.001, respectively.
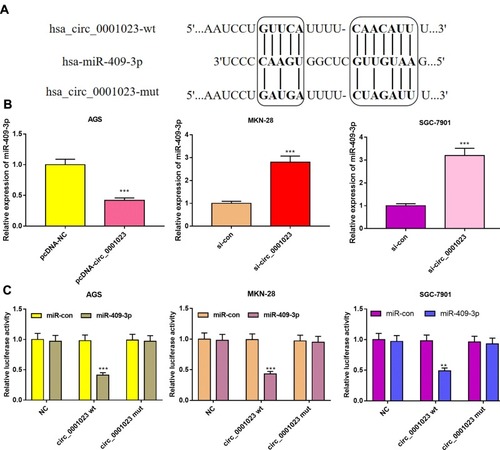
Figure 6 The correlations among the expression levels of circ_0001023, miR-409-3p, and PHF10. (A) The expression level of circ_0001023 was negatively correlated with that of miR-409-3p in 33 GC tissues. (B) The expression level of miR-409-3p was negatively correlated with the expression level of PHF10. (C) The expression level of PHF10 was positively correlated with the expression level of circ_0001023.
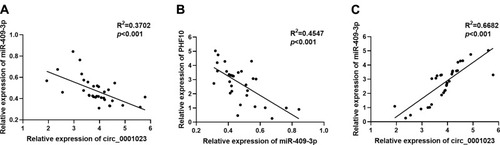
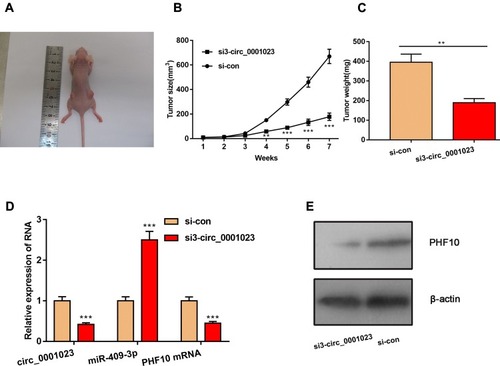
Figure 7 Knockdown of circ_0001023 can impede the growth of GC cells in vivo. (A) The representative diagram of tumorigenesis in nude mice was shown. (B, C) Knockdown of circ_0001023 could restrain the growth of tumors in vivo. (D) Knockdown of circ_0001023 inhibited the expressions of circ_0001023 and PHF10 mRNA in mice tumor tissues and upregulated the expression of miR-409-3p. (E) Western blot showed that knockdown of circ_0001023 repressed PHF10 protein expression. ** and *** represent p<0.01 and p< 0.001, respectively.