Figures & data
Table 1 The Relationship Between circLPAR3 and Clinical and Pathological Features of ESCC Patients
Figure 1 The expression of circLPAR3 was increased in esophageal squamous cell carcinoma (ESCC) tissues and cells. (A) The expression of circLPAR3 in ESCC tissues (ESCC) and adjacent normal tissues (Normal) was detected by qRT-PCR. (B) The expression of circLPAR3 in the peripheral blood of ESCC patients and healthy peoples was measured by qRT-PCR. (C) QRT-PCR was used to determine the circLPAR3 expression in ESCC cell lines (EC109, EC9706, KYSE30 and KYSE150) and HET-1A cells. (D) Kaplan-Meier analysis was performed to examine the correlation between circLPAR3 expression and overall survival of ESCC patients. (E) The relative expression levels of circLPAR3 and Glyceraldehyde 3-phosphate dehydrogenase (GAPDH) in KYSE30 and KYSE150 cells were assessed by qRT-PCR after treatment with RNase R. (F) The expression levels of circLPAR3, U6 and GAPDH in the nuclear and cytoplasmic of KYSE30 and KYSE150 cells were detected by qRT-PCR after nuclear-cytoplasmic separation. *P < 0.05.
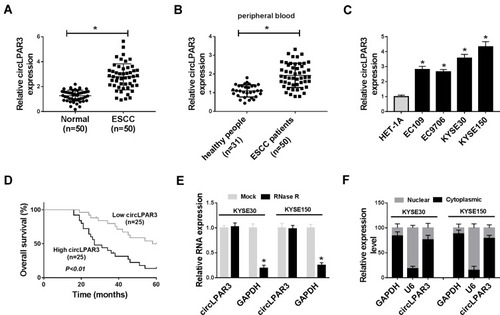
Figure 2 Effect of circLPAR3 knockdown on esophageal squamous cell carcinoma (ESCC) progression. KYSE30 and KYSE150 cells were transfected with (short hairpin) sh-circLPAR3#1/2 or short hairpin-negative control (sh-NC). (A) The expression of circLPAR3 was detected by qRT-PCR to evaluate transfection efficiency. (B, C) CCK-8 assay was used to assess the viability of KYSE30 and KYSE150 cells. (D) Colony formation assay was performed to measure the number of colonies in KYSE30 and KYSE150 cells. (E, F) The number of migrated and invaded KYSE30 and KYSE150 cells was determined by transwell assay. (G) Western blot (WB) analysis was performed to assess the protein levels of proliferating cell nuclear antigen (PCNA), Ki-67, matrix metalloproteinase2 (MMP2) and MMP9 in KYSE30 and KYSE150 cells. *P < 0.05.
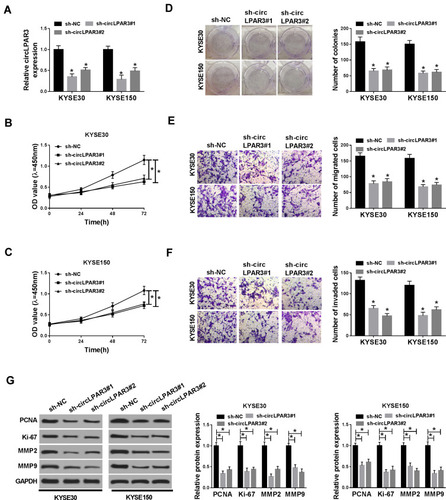
Figure 3 Effect of circLPAR3 silencing on esophageal squamous cell carcinoma (ESCC) tumor growth in vivo. (A) Tumor volume was calculated with length × width2/2 method at the indicated time point. (B) Tumor weight was measured in mice. (C) The expression of circLPAR3 was detected by qRT-PCR to evaluate transfection efficiency. (D) The protein levels of proliferating cell nuclear antigen (PCNA), Ki-67, matrix metalloproteinase2 (MMP2) and MMP9 were tested by Western blot (WB) analysis. *P < 0.05.
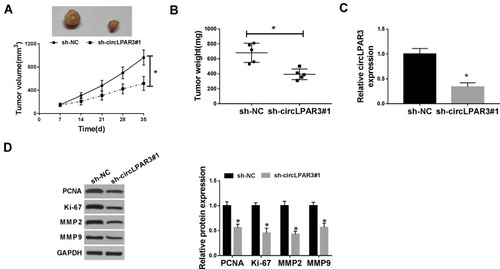
Figure 4 CircLPAR3 could sponge miR-375/miR-433. (A) The sequences of circLPAR3 containing the miR-375/miR-433 binding sites or mutant binding sites were shown. (B, C) Dual-luciferase reporter assay was used to detect the interaction between miR-375/miR-433 and circLPAR3 in KYSE30 and KYSE150 cells. (D) RNA pull-down assay was performed to determine the enrichment of miR-375 and miR-433 in Bio-circLPAR3 or Bio-(negative control) NC (E) The effects of sh-circLPAR3#1 on the expression levels of miR-375 and miR-433 in KYSE30 and KYSE150 cells were detected by qRT-PCR. (F, G) The expression levels of miR-375 and miR-433 in ESCC tissues (ESCC) and adjacent normal tissues (Normal) were determined by qRT-PCR. (H, I) The correlation between circLPAR3 and miR-375 or miR-433 was measured by Pearson correlation analysis. *P < 0.05.
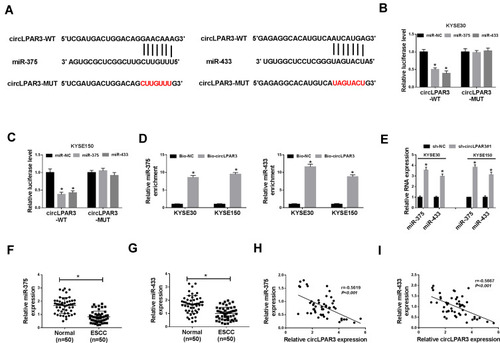
Figure 5 Effects of miR-375 and miR-433 inhibitors on esophageal squamous cell carcinoma (ESCC) progression. (A) The expression levels of miR-375 and miR-433 were detected by qRT-PCR to evaluate the transfection efficiency of anti-miR-375 and anti-miR-433. KYSE30 and KYSE150 cells were co-transfected with sh-circLPAR3#1 and anti-miR-375 or anti-miR-433. (B) The viability of KYSE30 and KYSE150 cells was measured by CCK-8 assay. (C) Colony formation assay was used to assess the number of colonies in KYSE30 and KYSE150 cells. (D, E) Transwell assay was performed to determine the number of migrated and invaded KYSE30 and KYSE150 cells. (F, G) The protein levels of proliferating cell nuclear antigen (PCNA), Ki-67, matrix metalloproteinase2 (MMP2) and MMP9 in KYSE30 and KYSE150 cells were tested by Western blot (WB) analysis. *P < 0.05.
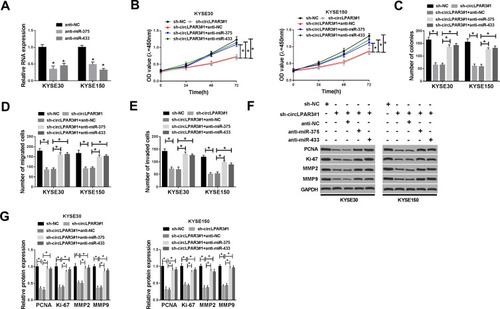
Figure 6 HMGB1 was a target of miR-375/miR-433. (A) The binding sites and mutant binding sites between high-mobility group box 1 (HMGB1) and miR-375/miR-433 were shown. (B, C) Dual-luciferase reporter assay was used to detect the interaction between HMGB1 and miR-375/miR-433 in KYSE30 and KYSE150 cells. (D) The expression levels of miR-375 and miR-433 were determined by qRT-PCR to evaluate the transfection efficiency of miR-375 and miR-433 mimics. (E, F) The mRNA and protein levels of HMGB1 were measured by qRT-PCR and WB analysis to evaluate the effect of miR-375/miR-433 overexpression on HMGB1 expression. KYSE30 and KYSE150 cells were co-transfected with (short hairpin) sh-circLPAR3#1 and anti-miR-375 or anti-miR-433. (G) The protein level of HMGB1 was tested by Western blot (WB) analysis in KYSE30 and KYSE150 cells. *P < 0.05.
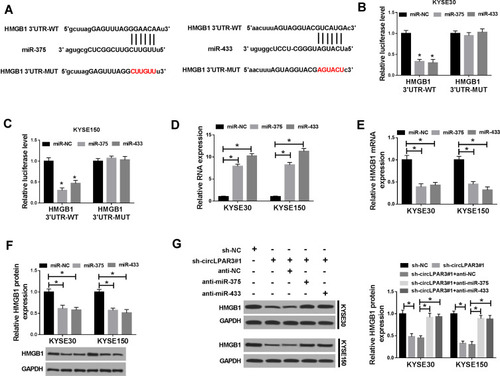
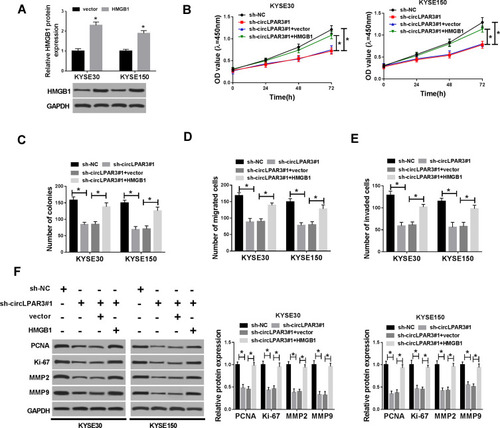
Figure 7 Effect of HMGB1 overexpression on esophageal squamous cell carcinoma (ESCC) progression. (A) The protein level of high-mobility group box 1 (HMGB1) was detected by Western blot (WB) analysis to evaluate the transfection efficiency of HMGB1 overexpression plasmid. KYSE30 and KYSE150 cells were co-transfected with (short hairpin) sh-circLPAR3#1 and HMGB1 overexpression plasmid. (B) CCK-8 assay was performed to measure the viability of KYSE30 and KYSE150 cells. (C) Colony formation assay was used to test the number of colonies in KYSE30 and KYSE150 cells. (D, E) The number of migrated and invaded KYSE30 and KYSE150 cells was assessed by transwell assay. (F) The protein levels of proliferating cell nuclear antigen (PCNA), Ki-67, matrix metalloproteinase2 (MMP2) and MMP9 in KYSE30 and KYSE150 cells were determined by WB analysis. *P < 0.05.