Figures & data
Table 1 Primer Sequence of RT-PCR
Figure 1 Indicators of model success. (A) Compared with the NC group, the miR-145agomir group had less abdominal distension. (B) H&E staining showed large nuclear staining, lymphoblastic liver cancer H22 cells.
Abbreviations: NC, negative control; H&E, hematoxylin & eosin.
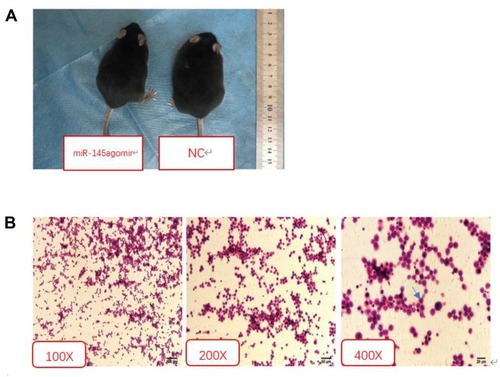
Figure 2 miR-145 negatively regulates Th9 cell polarization in vitro (n=3). CD4+ T cells were obtained and then cultured in RPMI 1640 media containing 10% FBS. MiR-145 mimics or negative control oligonucleotide were transfected into CD4+ T cells, followed by the addition of TGF-β (2 ng/mL) and IL-4 (10 ng/mL). (A, B) After 72 h, relative expressions of miR-145 and IL-9 mRNA were measured by RT-PCR. (C, D) Th9 cells were analyzed by flow cytometry. (E) ELISA was used to detect IL-9 levels in the culture supernatant.
Notes: The data represent the mean ± standard deviation (SD) from three independent experiments. *P<0.05; ***P<0.01.
Abbreviations: RPMI, Roswell Park Memorial Institute; FBS, fetal bovine serum; NC, negative control; TGF-β, transforming growth factor-β; IL, interleukin; RT-PCR, reverse transcription-polymerase chain reaction; ELISA, enzyme linked immunosorbent assay.
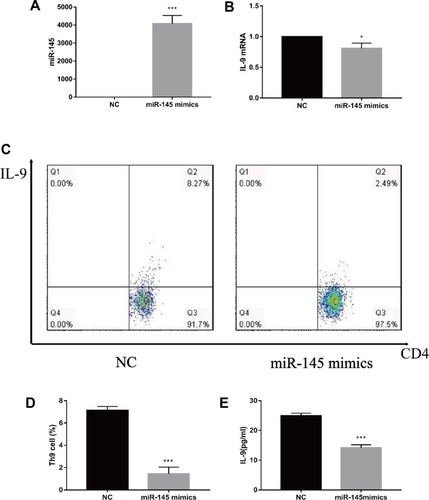
Figure 3 miR-145 inhibits HIF-1α expression in vitro (n=3). CD4+ T cells were obtained and transfected with miR-145 mimics or negative control oligonucleotide, followed by incubation for 3 days in the presence of TGF-β (2 ng/mL) and IL-4 (10 ng/mL). (A) HIF-1α mRNA was measured by RT-PCR. (B) Immunofluorescence was used to detect the expression of HIF-1α (Bar = 10 um).
Notes: The data represent the mean ± standard deviation (SD) from three independent experiments. *P<0.05.
Abbreviations: HIF-1α, hypoxia-inducible factor-1α; DAPI, 4ʹ,6-diamidino-2-phenylindole; NC, negative control; TGF-β, transforming growth factor-β; IL, interleukin; RT-PCR, reverse transcription-polymerase chain reaction.
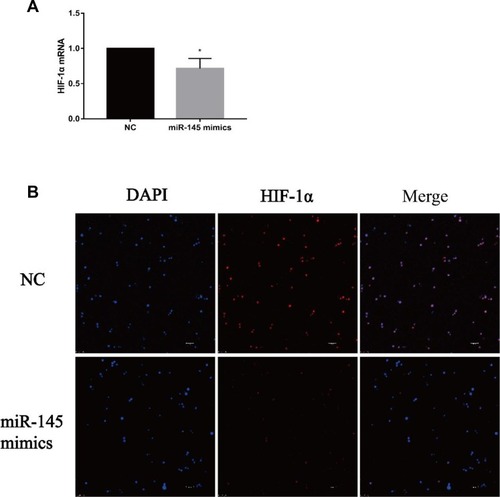
Figure 4 miR-145 inhibits PI3K/Akt/mTOR/p70S6K pathway activation in vitro (n=3). CD4+T cells were obtained and transfected with miR-145 mimics or negative control oligonucleotide. TGF-β (2 ng/mL) and IL-4 (10 ng/mL) were added. Expressions of PI3K mRNA (A), Akt mRNA (B), mTOR mRNA (C), and p70S6K mRNA (D) were measured by RT-PCR. Immunofluorescence for PI3K (E), Akt (F), mTOR (G), and p70S6K (H) (Bar = 10 um).
Notes: The data represent the mean ± standard deviation (SD) from three independent experiments. *P<0.05; ***P<0.01.
Abbreviations: PI3K, phosphatidylinositol-3-kinase; Akt, protein kinase B; mTOR, mammalian target of rapamycin; p70S6K, p70 ribosomal protein S6 kinase; DAPI, 4ʹ,6-diamidino-2-phenylindole; NC, negative control; TGF-β, transforming growth factor-β; IL, interleukin; RT-PCR, reverse transcription-polymerase chain reaction.
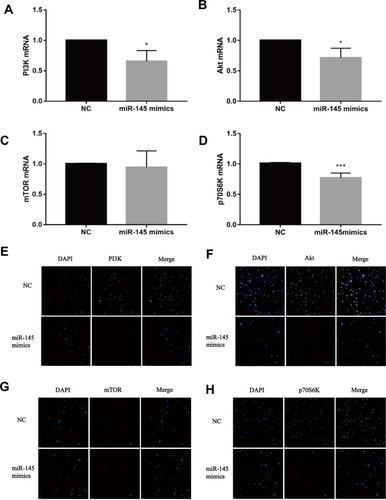
Figure 5 miR-145 inhibits Th9 cell production in a mouse model of MA (n=5). Construction of a mouse mode of MA in liver cancer, and intravenous injection of mmu-miR-145-5pagomir or negative control oligonucleotide. After 2 weeks, mice were sacrificed, and spleen tissue was isolated. (A, B) relative expressions of miR-145 and IL-9 mRNA were measured by RT-PCR. (C, D) Th9 cells were analyzed by flow cytometry. (E) ELISA was used to detect IL-9 levels. (F) The relationship between miR-145 and Th9 cells. *P<0.05; ***P<0.01.
Abbreviations: MA, malignant ascites; NC, negative control; IL, interleukin; CD4, T helper cells; RT-PCR, reverse transcription-polymerase chain reaction; ELISA, enzyme linked immunosorbent assay.
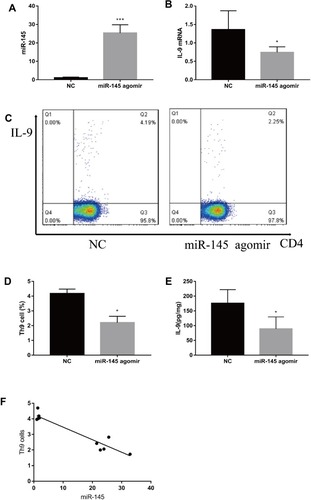
Figure 6 miR-145 suppresses HIF-1α expression in an MA model (n=5). Construction of a mouse model of MA in liver cancer, and intravenous injection of mmu-miR-145-5pagomir or negative control oligonucleotide. After 2 weeks, mice were sacrificed, and spleen tissue was isolated. (A) HIF-1α mRNA was measured by RT-PCR. (B) ELISA was used to detect the expression of HIF-1α. (C, D) Western blotting for HIF-1α. *P<0.05; ***P<0.01.
Abbreviations: HIF-1α, hypoxia-inducible factor-1α; MA, malignant ascites; NC, negative control; RT-PCR, reverse transcription-polymerase chain reaction; ELISA, enzyme linked immunosorbent assay.
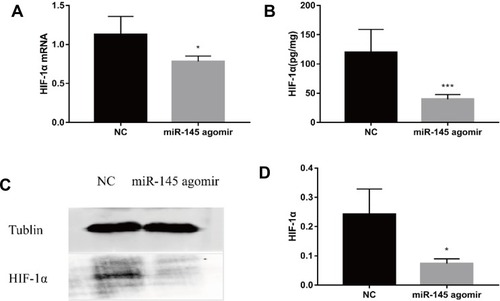
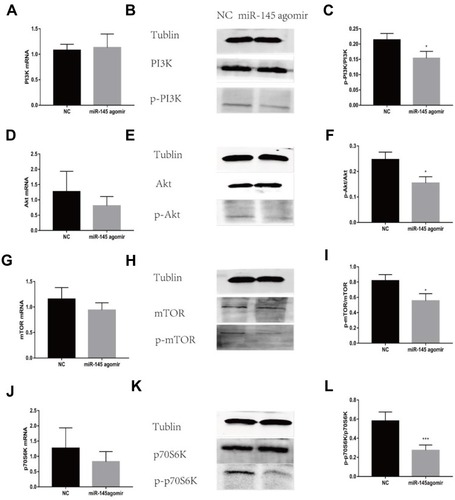
Figure 7 miR-145 inhibits PI3K/Akt/mTOR/p70S6K pathway activation in a mouse model of MA (n=5). Construction of a mouse model of MA in liver cancer, and intravenous injection of mmu-miR-145-5pagomir or negative control oligonucleotide. After 2 weeks, mice were sacrificed, and spleen tissue was isolated. PI3K mRNA (A), Akt mRNA (D), mTOR mRNA (G), and p70S6K mRNA (J) were measured by RT-PCR. Western blotting for p-PI3K (B, C), p-Akt (E, F), p-mTOR (H, I), and p-p70S6K (K, L). *P<0.05. ***P<0.01.
Abbreviations: PI3K, phosphatidylinositol-3-kinase; p-PI3K, phosphorylation-phosphatidylinositol-3-kinase; Akt, protein kinase B; p-Akt, phosphorylation-protein kinase B; mTOR, mammalian target of rapamycin; p-mTOR, phosphorylation-mammalian target of rapamycin; p70S6K, p70 ribosomal protein S6 kinase; p-p70S6K, phosphorylation-p70 ribosomal protein S6 kinase; MA, malignant ascites; NC, negative control; RT-PCR, reverse transcription-polymerase chain reaction.