Figures & data
Figure 1 ZFAS1 is upregulated in HCC patients and associated with poor prognosis. (A) The normal tissues and tumor tissues were analyzed by Arraystar Human LncRNA microarray V2.0 (Agilent_033010 Probe Name version). Heatmap represents for 30 ectopic expressed lncRNAs. (B) The ZFAS1 expression between normal tissues and tumor tissues measured by RT-qPCR. (C) ZFAS1 expression in normal tissues (n = 160) and tumor tissues (n = 369) validated with TCGA database by GEPIA (http://gepia.cancer-pku.cn/index.html). (D) Kaplan–Meier survival analysis of HCC patients with high or low ZFAS1 expression. (E) The ZFAS1 expression between human normal hepatocytes L02 and HCC cell lines assessed by RT-qPCR. (F) siRNAs targeting ZFAS1 sequences were transfected into HepG2 and SMMC7721 cells while scramble siRNA served as negative control. The data are expressed as the mean ± SD. In panel (E and F), one-way ANOVA and Tukey’s multiple comparison test were used to determine statistical significance, while in panel A, paired t test was used. In panel C, E, and F, *p < 0.05 vs tumor tissues, L02 cells or Scramble treatment; In panel B, **p < 0.01 vs adjacent tissues.
Abbreviations: HCC, hepatocellular carcinoma; TCGA, The Cancer Genome Atlas; GEPIA, gene expression profiling interactive analysis; lncRNA; long noncoding RNA; LIHC, liver hepatocellular carcinoma; ZFAS1, ZNFX1 antisense RNA 1; RT-qPCR, reverse transcription-quantitative polymerase chain reaction; siRNA, small interfering RNA; SD, standard deviation; ANOVA, analysis of variance.
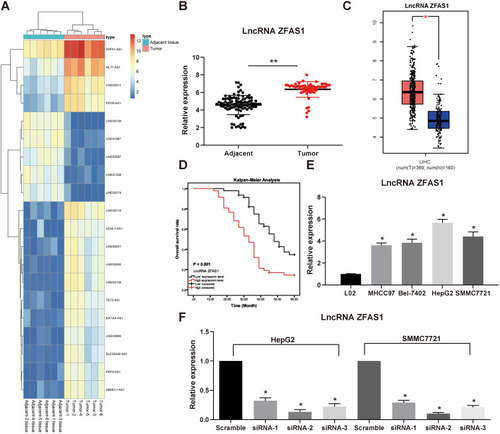
Table 1 Association Between ZFAS1 Expression with Clinical Characteristics of HCC Patients
Figure 2 ZFAS1 downregulation in HCC cell inhibited its malignant behaviors. (A) The living and dead cells were visualized by EdU staining where green indicated living cells stained by Calcein-AM while red signified dead cells stained by EthD III. (B) PI/Annexin V-labeled cells analyzed by flow cytometry to determine apoptosis index. (C) E-cadherin and Vimentin expression determined by immunofluorescence staining, RT-qPCR, and Western blot. (D) Migration ability of HCC cells determined by Transwell assay. (E) Invasion ability of HCC cells determined by Transwell assay. The data are expressed as the mean ± SD. One-way ANOVA and Tukey’s multiple comparison test were used to determine statistical significance. *p < 0.05 vs Scramble treatment; **p < 0.01 vs Scramble treatment.
Abbreviations: HCC, hepatocellular carcinoma; siRNA, small interfering RNA; ZFAS1, ZNFX1 antisense RNA 1; EdU, 5ʹ-ethynyl-2ʹ-deoxyuridine; PI, propidium iodide; RT-qPCR, reverse transcription-quantitative polymerase chain reaction; FITC, fluorescein isothiocyanate; SD, standard deviation; ANOVA, analysis of variance.
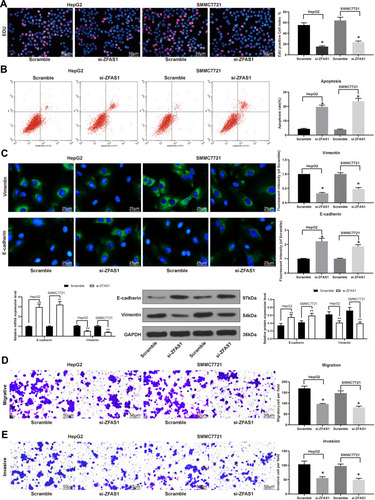
Figure 3 ZFAS1 serves as a ceRNA by sponging miR-624 with MDK. (A) Subcellular localization of ZFAS1 in the LncATLAS database. (B) The subcellular localization of ZFAS1 in HepG2 and SMMC7721 cells were stained with probes targeting ZFAS1 (green), and the nuclei were stained with DAPI (blue) by FISH. (C) Nuclear and cytoplasmic expression of ZFAS1 in HepG2 and SMMC7721 cells determined by RT-qPCR. (D) Luciferase reporter plasmids containing ZFAS1-WT or ZFAS1-MT were transfected into H293T cells together with miR-624 in parallel with an miR-NC plasmid vector. (E) miR-624 expression in healthy tissues and HCC tumor tissues in TCGA database by GEPIA. (F) Relative expression of miR-624 in HCC cells treated with si-ZFAS1 determined by RT-qPCR. (G) miR-624 expression in normal tissues and tumor tissues determined by RT-qPCR. (H) Luciferase reporter plasmids containing MDK-WT or MDK-MT were transfected into H293T cells together with miR-624 in parallel with an miR-NC plasmid vector. (I) MDK expression of normal tissues (n = 160) and tumor tissues (n = 369) in TCGA database by GEPIA (http://gepia.cancer-pku.cn/index.html). (J) Relative expression of MDK determined in HCC cells treated with si-ZFAS1 determined by RT-qPCR. (K) MDK expression in collected normal tissues and tumor tissues. One-way ANOVA and Tukey’s multiple comparison test were used or paired t test was used to determine statistical significance. *p < 0.05 vs miR-negative control or Scramble treatment; **p < 0.01 vs adjacent tissues.
Abbreviations: siRNA, small interfering RNA; ZFAS1, ZNFX1 antisense RNA 1; ceRNA, competing endogenous RNA; WT, wild type; MT, mutant; LIHC, liver hepatocellular carcinoma; RPM, reads per kilobase of exon model per million mapped reads; MDK, midkine; DAPI, 4ʹ,6-diamidino-2-phenylindole; FISH, fluorescence in situ hybridization; HCC, hepatocellular carcinoma; TCGA, The Cancer Genome Atlas; GEPIA, gene expression profiling interactive analysis; NC, negative control; miR, microRNA; RT-qPCR, reverse transcription-quantitative polymerase chain reaction; SD, standard deviation; ANOVA, analysis of variance.
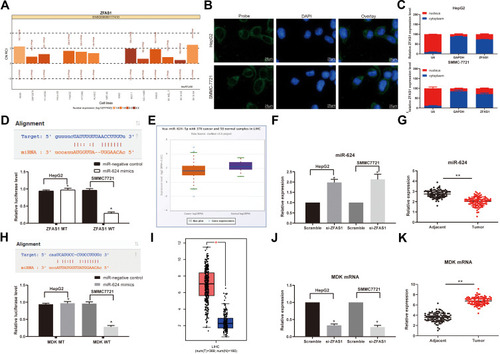
Figure 4 Inhibition of miR-624 restores HCC cell malignant behaviors induced by ZFAS1 silencing. (A) EdU staining of proliferating cells. (B) TUNEL staining of apoptotic cells. (C) Vimentin expression determined by immunofluorescence staining, RT-qPCR, and Western blot. (D) Migration ability determined by Transwell assays. (E) Invasion ability measured by Transwell assays. The data are expressed as the mean ± SD. One-way ANOVA and Tukey’s multiple comparison test were used to determine statistical significance. *p < 0.05 vs si-ZFAS1 + Mock treatment; **p < 0.01 vs si-ZFAS1 + Mock treatment.
Abbreviations: ZFAS1, ZNFX1 antisense RNA 1; EdU, 5ʹ-ethynyl-2ʹ-deoxyuridine; DAPI, 4ʹ,6-diamidino-2-phenylindole; TUNEL, terminal deoxynucleotidyl transferase dUTP nick end labeling; In, inhibitor; GAPDH, glyceraldehyde-3-phosphate dehydrogenase; siRNA, small interfering RNA; HCC, hepatocellular carcinoma; miR, microRNA; RT-qPCR, reverse transcription-quantitative polymerase chain reaction; SD, standard deviation; ANOVA, analysis of variance.
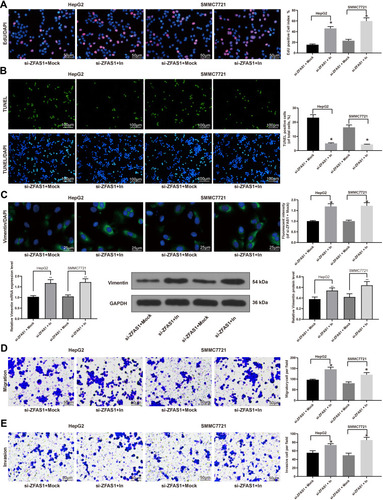
Figure 5 ZFAS1 silencing inhibits the induction of the ERK/JNK/P38 signaling pathway in HCC cells. (A) ERK/JNK/P38 protein level determined by Western blot assays. Then, an ERK specific agonist tert-butylhydroquinone (1.25 mM) was added in si-ZFAS1-transfected HepG2 and SMMC7721 cells. (B) EdU staining of proliferating cells. (C) PI/Annexin V-labeled cells were then analyzed by flow cytometry to determine apoptosis index. (D) Migration ability of HCC cells determined by Transwell assays. (E) Invasion ability of HCC cells determined by Transwell assays. The data are expressed as the mean ± SD. One-way ANOVA and Tukey’s multiple comparison test were used to determine statistical significance. *p < 0.05 vs Scramble or si-ZFAS1 + DMSO treatment; #p < 0.05 vs si-ZFAS1 + Mock treatment.
Abbreviations: ZFAS1, ZNFX1 antisense RNA 1; JNK, Jun n-terminal kinase; p, phosphorylated; HCC, hepatocellular carcinoma; ERK, extracellular signal-regulated kinase; EdU, 5ʹ-ethynyl-2ʹ-deoxyuridine; GAPDH, glyceraldehyde-3-phosphate dehydrogenase; In, inhibitor; siRNA, small interfering RNA; DMSO, dimethylsulfoxide; PI, propidium iodide; FITC, fluorescein isothiocyanate; SD, standard deviation; ANOVA, analysis of variance.
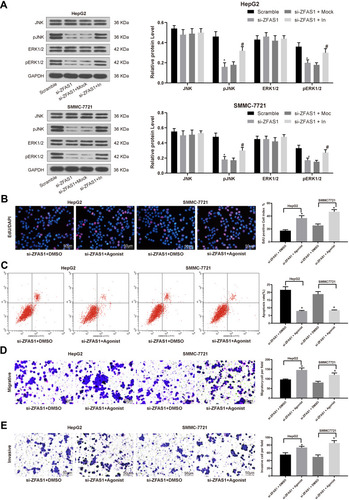
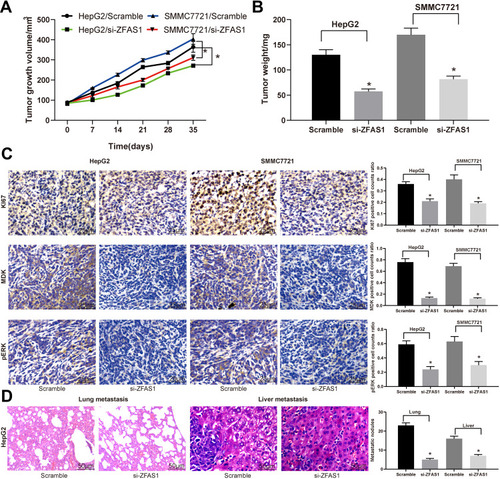
Figure 6 ZFAS1 downregulation in HCC cells inhibits its malignant behavior in vivo. HepG2 and SMMC7721 cells stably transfected with ZFAS1-siRNA or scramble siRNA were inoculated subcutaneously into BALB/c nude mice at a dose of 5 × 10⁶ (n = 6 in each group). Tumor growth was measured continuously at an interval of 7 days. At 35 days post-implantation, the mice were euthanized by overdosed pelltobarbitalum natricum. (A) Tumor size. (B) Tumor weight. (C) Immunostaining of Ki67-, MDK-, and pERK-positive tumor cells and quantification. (D) HE staining of lung and liver metastases in nude mice injected with HepG2 cells by tail-vein. The numbers of metastasis were determined at 45 days after HepG2 cells injection. One-way or two-way ANOVA and Tukey’s multiple comparison test were used to determine statistical significance, *p < 0.05 vs Scramble treatment.
Abbreviations: ZFAS1, ZNFX1 antisense RNA 1; HCC, hepatocellular carcinoma; p, phosphorylated; ERK, extracellular signal-regulated kinase; siRNA, small interfering RNA; MDK, midkine; HE, hematoxylin and eosin; ANOVA, analysis of variance.