Figures & data
Figure 1 Cytotoxic effects of salinomycin (SAL) and sulforaphane (SFN) both separately and in combination on two colorectal cancer (CRC) cell lines (Caco-2 and CX-1) in vitro. (A and B) Effects of different concentrations of SAL (0, 2.5, 5, 10, 20, 40, 80 μM) on the viability of CRC cells after 24, 48 and 72 h of treatment. (C and D) Effects of different concentrations of SFN (0, 5, 10, 20, 40, 60, 80, 100 μM) on the viability of colorectal cancer cells after 24, 48 and 72 h of treatment. (E, F and G) The combination index (CI) values were calculated according to Chou-Talalay’s method by CompuSyn software at the 24-h point and plotted with the percent of inhibition as the fraction affected (Fa) cells. Fa-CI plot analysis of the effect of the SAL and SFN combination treatment on Caco-2 and CX-1 cell viability was conducted. Each symbol was assigned a CI value for each Fa at twelve different combination ratios. CI values < 1 indicate drug synergism, CI values = 1 indicate an additive effect, and CI values > 1 indicate antagonism. A normalized isobologram for the combination of SAL and SFN was created. Each symbol represents a different combination ratio. A point above the line is antagonistic, a point on the line is additive, and a point below the line is synergistic. (H and I) Effects of 5 μM SAL, 10 μM SFN and the combination of both treatments on Caco-2 and CX-1 cell viability after 24 h (H) and 48 h (I) of treatment, as measured by the MTT assay. *P < 0.05, **P < 0.01, ***P < 0.001 (compared to control); ###P < 0.001 (compared to SFN treatment alone); &&P< 0.01, &&&P < 0.001 (compared to SAL treatment alone).
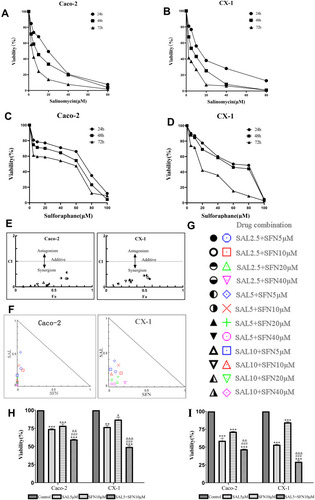
Table 1 Real-Time PCR Primer Sequences
Table 2 Effects of SAL and SFN as Single Drugs in Colorectal Cancer Cells
Figure 2 SAL and SFN cotreatment efficiently inhibited cell proliferation and induced apoptosis of CRC cells. (A and B) We determined that compared with treatment with DMSO, treatment with SAL, SFN and a combination of both drugs inhibited proliferation, as demonstrated by EdU (5-ethynyl-2’-deoxyuridine) staining after 48 h of treatment. Red indicates EdU staining, and blue indicates Hoechst staining of nuclei; the rate of EdU staining was calculated as follows: positive rate=number of posititotal number of c/total number of cells×100%. (C) Caco-2 and CX-1 cells were treated with DMSO, 5 μM SAL, 10 μM SFN or a combination of the two drugs for 48 h, and apoptosis was measured by fluorescence-activated cell sorting (FACS) based on annexin V-fluorescein isothiocyanate (FITC) and propidium iodide (PI) double staining. (D and E) Statistical analysis of the inhibition of proliferation and percentage of apoptosis induction among the control, monotherapy and cotreatment groups in Caco-2 and CX-1 cells. ***P < 0.001 (compared to the control); ###P < 0.001 (compared to SFN treatment alone); &&P < 0.01, &&&P < 0.001 (compared to SAL treatment alone).
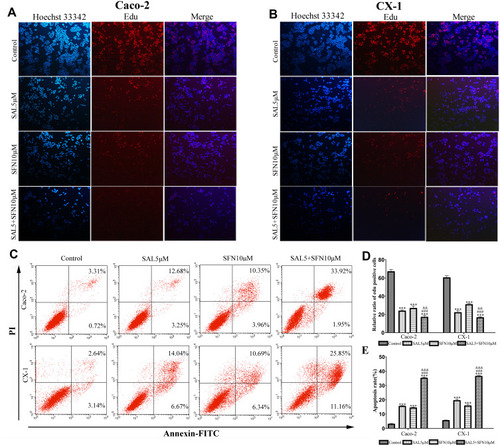
Figure 3 The combination treatment suppressed the migration and invasion of CRC cells as indicated by the transwell assay. (A) The effects of the control treatment, either monotherapy and cotreatment on the migration and invasion of Caco-2 and CX-1 cells (magnification ×200). The combination of SAL and SFN effectively decreased the number of migrated and invaded cells. (B and C) Quantification of Caco-2 and CX-1 cells migrating and invading through the collagen membrane. ***P < 0.001 (compared to the control); ##P < 0.01, ###P < 0.001 (compared to SFN treatment alone); &&P <0.01, &&&P < 0.001 (compared to SAL treatment alone).
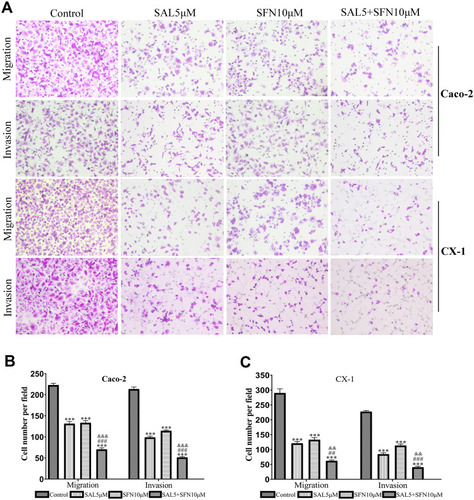
Figure 4 SAL and SFN cooperated to inhibit the PI3K/Akt pathway and modulate the expression of apoptotic markers. Caco-2 and CX-1 cells were treated for 48 h with the indicated concentrations of SAL and SFN either alone or in combination. (A and B) We performed a western blotting analysis of PI3K, Akt, p-Akt (Ser473), p53, Bcl-2, Bax and cleaved PARP protein expression in the two cell lines. (C, D, E, F, G and H) The relative expression of the above proteins was quantified with Image J software. The β-actin band served as a loading control. *P < 0.05, **P < 0.01, ***P < 0.001 (compared to the control); ##P < 0.01, ###P < 0.001 (compared to SFN treatment alone); &P < 0.05, &&P < 0.01, &&&P < 0.001 (compared to SAL treatment alone).
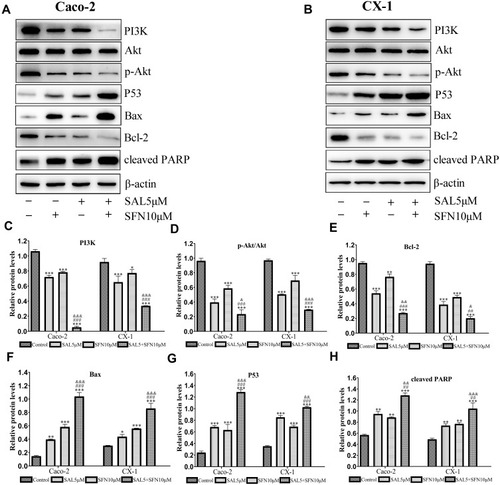
Figure 5 (A and B) Immunofluorescence staining showing endogenous expression of p-Akt in Caco-2 and CX-1 cells after treatment with DMSO, 5 μM SAL, 10 μM SFN or both drugs for 48 h. Immunofluorescent images of p-Akt (red) and DAPI-stained nuclei (blue) were obtained using a fluorescence microscope (magnification ×200). (C and D) The levels of Bcl-2 and Bax mRNA were detected by RT-qPCR. *P < 0.05, **P < 0.01, ***P < 0.001 (compared to the control); ###P < 0.001 (compared to SFN treatment alone); &&&P < 0.001 (compared to SAL treatment alone).
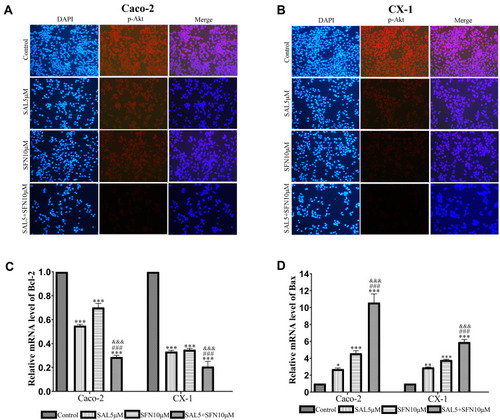
Figure 6 Inactivation of the PI3K/Akt pathway led to increased apoptosis and growth inhibition. (A) Cells were pretreated with 10 μM LY294002 for 90 min prior to receiving the combined treatment. The levels of p-Akt (Ser473) and cleaved PARP were detected by western blotting. (B) Effects of LY294002 on Caco-2 and CX-1 cells subjected to cotreatment. Cell viability was determined by the MTT assay. (C and D) The relative expression levels of p-Akt and cleaved PARP were quantified with Image J software. $$P < 0.01, $$$P < 0.001.
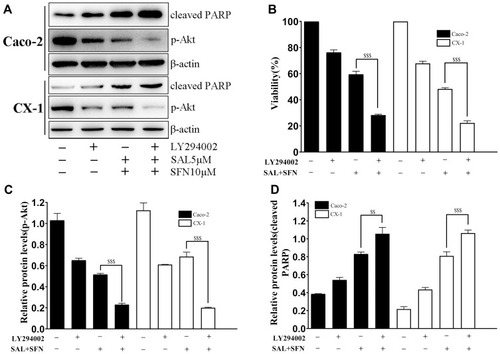
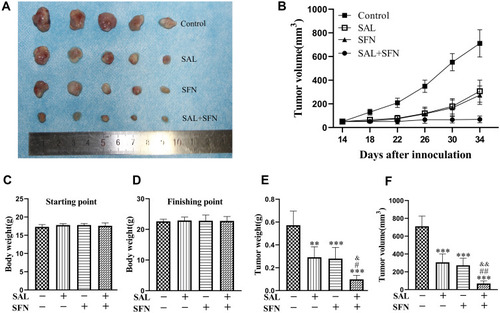
Figure 7 Regression of human colorectal cancer xenografts following combined treatment. (A) Tumor mass images of Caco-2 model mice on day 34. (B) The tumor sizes were measured every four days. The average tumor volume of each group of mice on different days is presented here. (C and D) Body weight of the mice from the indicated treatment groups at the start and end points of treatment. There was no significant difference among the four groups. (E) Bar graph representing the average tumor weight of each group of mice at the end of the experiment when the mice were killed on day 34. (F) Average tumor volume of each group of mice on day 34. The combined treatment significantly reduced tumor volume compared to that of the control and monotherapy treatments. **P < 0.01, ***P < 0.001 (compared to the control group); #P < 0.05, ##P < 0.01 (compared to SFN treatment alone); &P < 0.05, &&P < 0.01 (compared to SAL treatment alone).