Figures & data
Figure 1 Rap2c is up-regulated in glioma cells and tissues and influences the 5-year overall survival in glioma patients. (A) Protein expression of Rap2c in normal astrocytes and glioma cells (U87, U251, U118) determined by Western blotting. (B) Protein expression of Rap2c in normal brain tissues and glioma tissues quantified by Western blotting. (C) Rap2c protein expression in glioma tissue (Grade IV) and normal brain tissue as measured by IHC assay. Original magnifications, ×400. Scale bar, 20 μm for C. (D) Correlation between Rap2c expression and malignant progression of glioma. (E) Kaplan-Meier survival analysis of 180 glioma patients with low and high Rap2c expression (P<0.05, Log rank test), *P< 0.05; **P< 0.01.
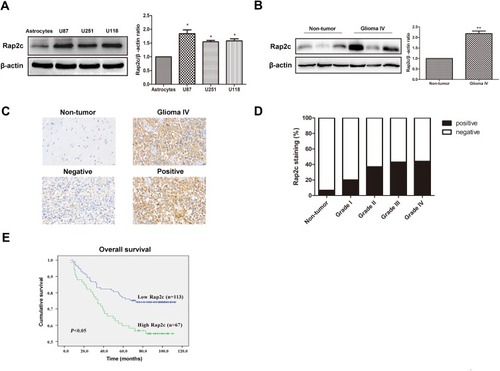
Table 1 The Correlation Between Rap2c Expression and Clinicopathological Characteristics Based on IHC Analysis
Figure 2 Rap2c promotes cell invasion and migration without affecting glioma cells proliferation. (A) Western blotting analysis of Rap2c protein expression after Rap2c overexpression in U87 and U118 cells. (B) Western blotting analysis of Rap2c protein expression after Rap2c knockdown in U87 and U118 cells. (C) Cell viability of U87 and U118 cells after transfection determined by CCK-8 assay. (D) Apoptosis of cells was detected by Annexin V-FITC/PI staining with flow cytometry. (E) Motility of U87 and U118 cells was measured using wound healing assay after Rap2c overexpression and knockdown. Original magnifications, ×100. (F) Cell migration and invasion were measured using transwell assays following transfection of glioma cells with Rap2c expression plasmid or siRNA. Original magnifications, ×200. Data are shown as mean ±SD for three independent experiments. *P< 0.05; **P< 0.01.
Abbreviations: siCtrl, siRNA control; siRap2c, siRNA Rap2c; Vector, empty vector; Rap2c, Rap2c overexpression; FITC, fluorescein isothiocyanate; PI, propidium iodide.
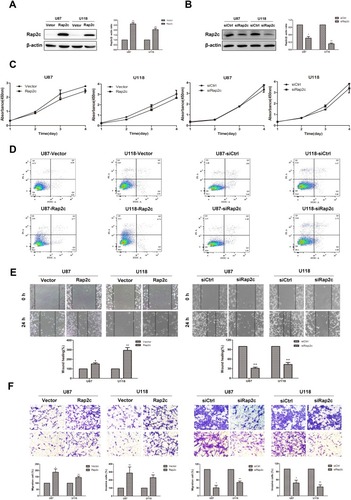
Figure 3 Rap2c alters the expression of EMT markers and enhances phosphorylation of MEK1/2 and ERK1/2. (A) Effects of Rap2c overexpression on EMT markers were analyzed by Western blotting. (B) Western blotting analysis of the protein levels of p-MEK1/2, MEK1/2, ERK1/2 and p-ERK1/2 in cells overexpressing Rap2c. Data are showed as mean ±SD (n=3). *P< 0.05; **P< 0.01.
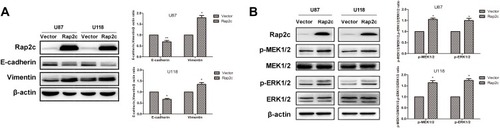
Figure 4 Rap2c increases phosphorylation of ERK1/2, which is abolished by U0126. (A) After transfection of Rap2c, cells were incubated in the presence of 10 μmol/L U0126 for 30 min. Western blotting analysis of protein levels of Rap2c, ERK1/2, p-ERK1/2 in U87 and U118 cells. (B) Wound healing assay results for cells overexpressing Rap2c and pretreated with U0126. (C) Migration assays results for cells overexpressing Rap2c and pretreated with U0126. (D) Cell invasion was measured by using invasion assay following transfection of glioma cells with Rap2c. Data are presented as mean±SD from three independent experiments. *P<0.05, **P<0.01 vs. vector; &P<0.05, &&P<0.01 vs. Rap2c.
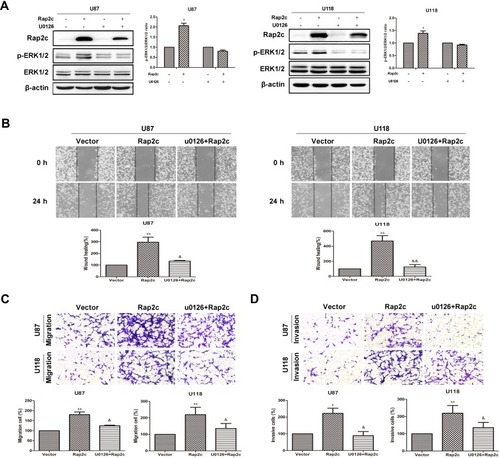
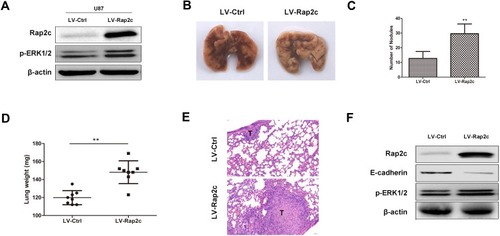
Figure 5 Rap2c promotes glioma cell metastasis in vivo. (A) Protein levels of p-ERK1/2 and Rap2c were detected by Western blotting in stable transfected U87 cells. (B) Lungs removed from mice injected with lentivirus-mediated glioma cells. (C) Number of metastatic nodules on lung tissues. (D) Weights of lung tissues. (E) H&E staining of lung sections. Scale bar, 50 μm for E. (F) Protein levels of ERK phosphorylation and E-cadherin in lung tissues detected by Western blotting. Data are showed as mean ± SD. **P< 0.01.