Figures & data
Figure 1 Fabrication of the morphology and structure of MDA-MB-231 spheroids. (A) Agarose microwells. (B) MDA-MB-231 spheroids in microwells. (C and D) H&E staining of MDA-MB-231 spheroids fixed at day 9 and 14. Scale bars, 100 μm.
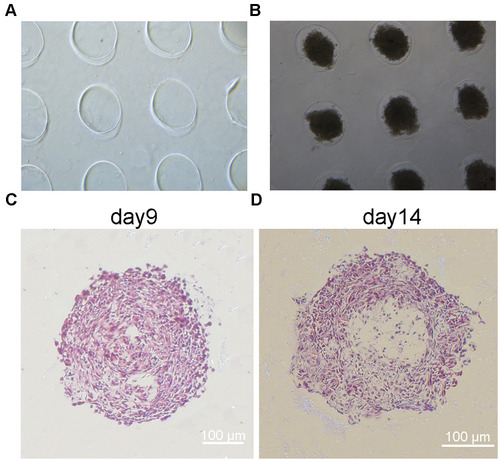
Figure 2 The growth characterization of MDA-MB-231 spheroid (3D) cultures. (A) CellTiter-Glo® 3D Cell Viability assays of MDA-MB-231 cells from 3D and 2D cultures. The activity index is defined as a ratio of luminescence value relative to that on the date of seeding (day 0). (B) Histological examination of spheroids, with the proliferation marker Ki67 (brown) and hematoxylin (blue) being used to stain the nuclei. Scale bars, 100 μm. (C) The viability of MDA-MB-231 cells measured by flow cytometry based on PI uptake and annexin V-FITC labeling. The percentage of apoptotic or necrotic cells was significantly higher in the 3D group after 14 days of spheroid culture. Data in (A and C) are expressed as mean ± SD from three independent replicates. *P<0.05,**P<0.01 versus the 2D group; ##P<0.01 versus the 3D group.
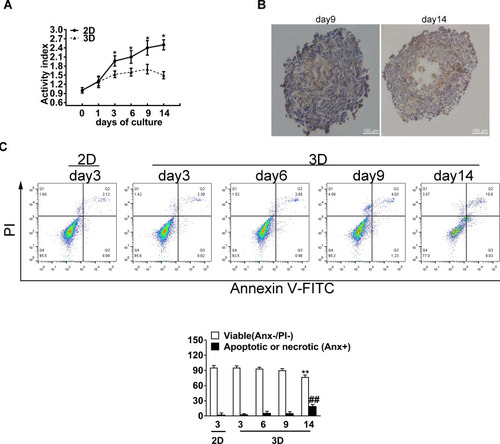
Figure 3 Spheroid (3D) culture promotes the migration and invasion of MDA-MB-231 cells. (A) Transwell assay showed that transferring the MDA-MB-231 spheroids to 2D culture significantly increased the migration and invasion capacities than those of 2D after 9 days of culture. Scale bars, 50 μm. (B) Quantitative analysis of the relative migration capacity by measuring the optical density of crystal violet at 570 nm. (C) MDA-MB-231 cells were scratched for 24 h under the serum-free culture condition. Scale bars, 50 μm. Then, wound healing was analyzed using the ImageJ software. Data are expressed as mean ± SD from three independent replicates. *P<0.05, **P<0.01 versus the 2D group.
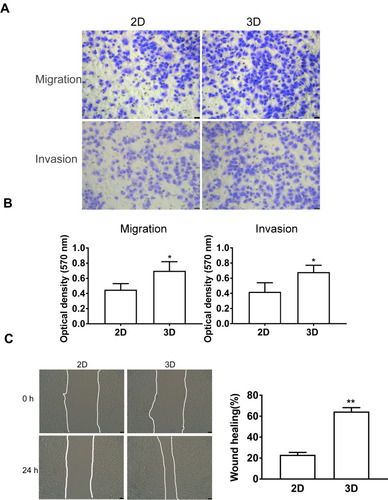
Figure 4 MDA-MB-231 spheroids significantly contribute to the expression levels of EMT maker compared with 2D culture. (A) Western blotting analysis on the expression of EMT-associated proteins E-cadherin and N-cadherin. GAPDH was used as the internal reference. (B) The gray value of protein was analyzed by the ImageJ software. (C) Confocal immunofluorescence staining of 3D spheroids and 2D MDA-MB-231 cells with EMT-associated cell markers E-cadherin and N-cadherin after 9 days of culture, and the cell nuclei were stained with DAPI (blue). Scale bars, 200 μm. Data are expressed as mean ± SD from three independent replicates. *P<0.05, **P<0.01 versus the 2D group.
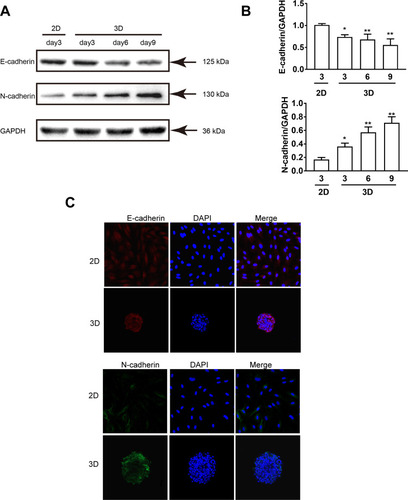
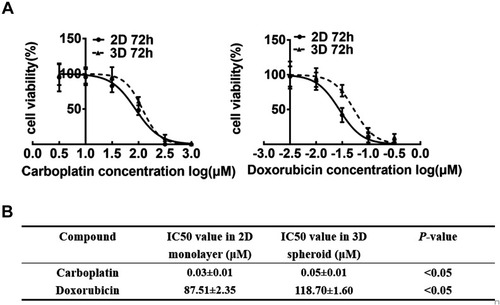
Figure 5 Drug-induced sensitivity of 2D and 3D cells. (A) Viability of 2D MDA-MB-231 (filled circle) and 3D MDA-MB-231 (filled triangle) cells after 72 h of compound exposure. The CellTiter-Glo® 3D Cell Viability Assay was performed to assess cytotoxicity. (B) Half-maximal inhibitory concentration (IC50) values of Carboplatin and Doxorubicin of MDA-MB-231 spheroids (3D) and monolayer culture (2D) after 72 h of drug exposure. Data are expressed as mean ± SD from three independent replicates.