Figures & data
Figure 1 Differentially methylated CpG sites between breast cancer tissues and matched adjacent tissues. (A) Heat map showing a distinguishable methylated CpG sites between breast cancer tissues and matched adjacent tissues. (B) Volcano plot of the differentially methylated CpG sites. The red spots represented hypermethylated CpG sites, and the green spots represented hypomethylated CpG sites. An adj.p.value < 0.05 or |delta beta| ≥ 0.2 was set as criteria.
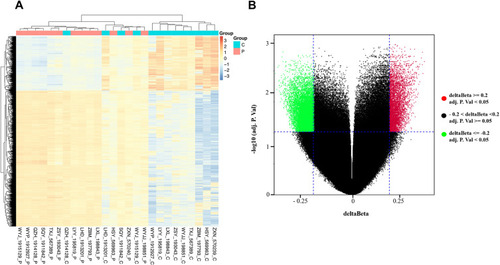
Figure 2 Detection of methylation sites through pyrosequencing. (A and B) MSP analysis of cg21899596 (HOPX promoter region) methylation in MCF-10A, MDA-MB-468, MCF-7 and SKBR3 cells. (C and D) MSP analysis of cg24862548 (HOPX promoter region) methylation in MCF-10A, MDA-MB-468, MCF-7 and SKBR3 cells. **P < 0.01, compared with the MCF-10A group.
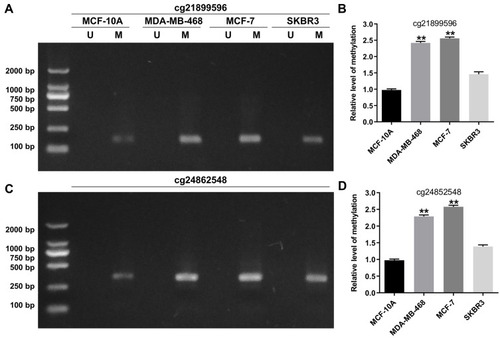
Figure 3 Overexpression of HOPX induced apoptosis in breast cancer cells. (A) Relative expression of HOPX expression in breast cancer cell lines and normal breast cell line (B) The level of HOPX in MCF-7 and MDA-MB-468 cells infected with lenti-HOPX was detected using RT-qPCR. (C) MCF-7 and MDA-MB-468 cells were infected with lenti-HOPX for 0, 24, 48 and 72 h. CCK-8 assay was used to measure cell viability. (D) MCF-7 and (E) MDA-MB-468 cells were infected with lenti-HOPX for 72 h. Apoptotic cells were detected with Annexin V and PI double staining. **P < 0.01, compared with the NC group.
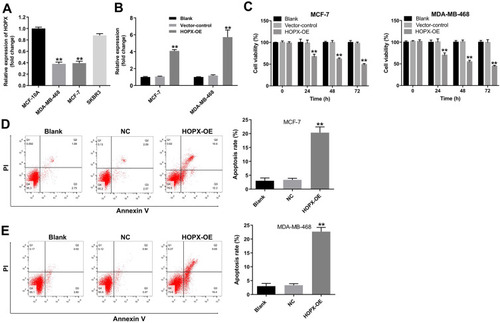
Figure 4 Overexpression of HOPX inhibited migration and invasion abilities of breast cancer cells. (A) MDA-MB-468 cells were infected with lenti-HOPX for 48 h. Wound healing assay was used to detect cell migration ability. (B) MDA-MB-468 cells were infected with lenti-HOPX for 24 h. Transwell invasion assay was used to detect cell invasion ability. **P < 0.01, compared with the NC group.
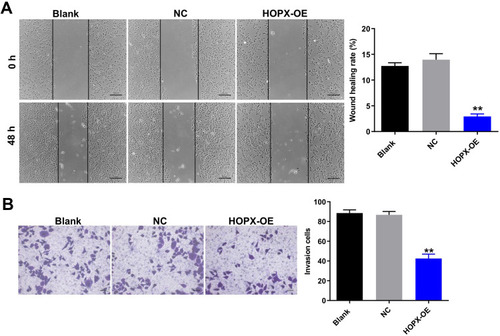
Figure 5 Overexpression of HOPX induced cell cycle arrest in breast cancer cells. MDA-MB-468 cells were infected with lenti-HOPX for 72 h. (A) Expression levels of HOPX, p21, cyclin D1 and CDK4 in MDA-MB-468 cells were detected with Western blotting. (B) The relative expressions of HOPX, p21, cyclin D1 and CDK4 in MDA-MB-468 cells were quantified via normalization to β-actin. (C and D) Cell cycle distribution was determined using flow cytometry. **P < 0.01, compared with the NC group.
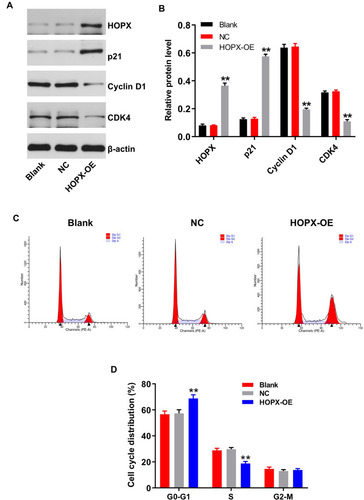
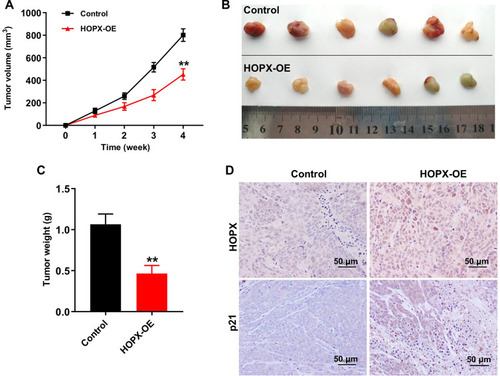
Figure 6 Upregulation of HOPX inhibited tumor growth in MDA-MB-468 xenografts in vivo. (A) Tumor volumes of animals were monitored weekly. (B) Xenografts tumors were photographed and (C) tumor weights of animals were calculated. (D) Expression levels of HOPX and p21 in tumor tissues were detected with IHC. Scale bars are 50 μm. **P < 0.01, compared with the control group.