
Figures & data
Table 1 Baseline Demographics and Characteristics for the Obesity and Non-Obesity Populations
Figure 1 Patient disposition in our study.
Note: Flow diagram showing patient enrollment, allocation, follow-up, and analysis in this study.
Abbreviations: BMI, body mass index; BC, breast cancer.
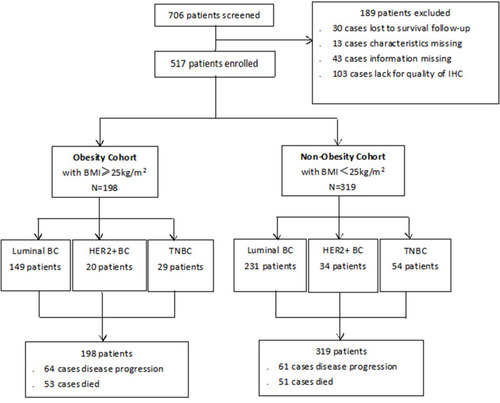
Figure 2 Representative micrographs of immunohistochemical stains showing Aurora A expression high staining (A), Aurora A expression median staining (B), Aurora A expression weak staining (C), Aurora A expression negative (D).
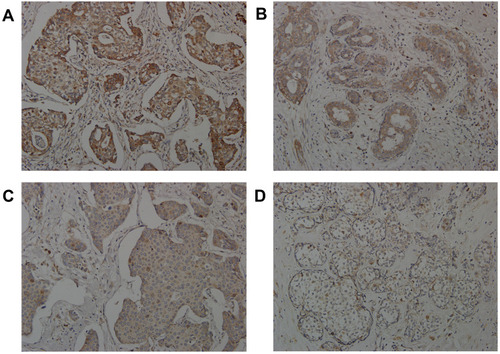
Figure 3 Association of Aurora A expression with BMI in the obesity cohort (A), and the non-obesity cohort (B).
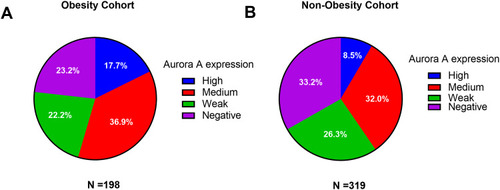
Figure 4 Prognostic significance of Aurora A expression for OS in breast cancer.
Note: Kaplan–Meier survival curves for overall survival as a function of expression of Aurora A in patients with obesity breast cancer (A), and non-obesity breast cancer (B).
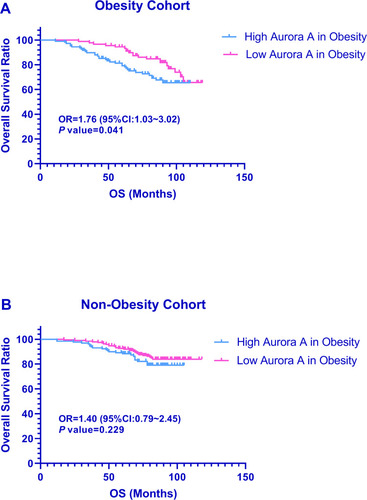
Figure 5 Prognostic significance of Aurora A expression for RFS in breast cancer.
Note: Kaplan–Meier survival curves for relapse-free survival as a function of expression of Aurora A in patients with obesity breast cancer (A), and non-obesity breast cancer (B).
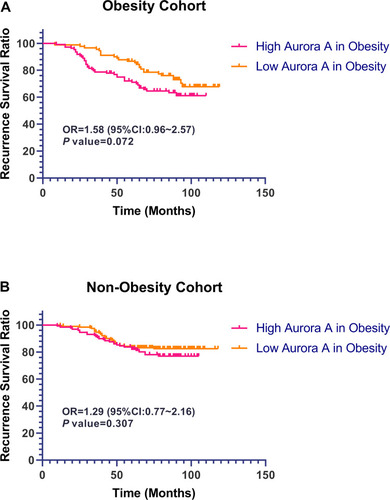
Table 2 Univariate and Multivariate Cox Regression Analyses for OS in Our Study
Figure 6 Prognostic significance of expression of Aurora A in breast cancer from TCGA public database.
Notes: Expression of Aurora A in cellular structure (A), the significant differences between normal and cancer in Pan-cancer (B). Construction of the PPI network and identification of a significant module with high Aurora A expression by cytoscape (C). The most significant module (AURKA and CCNB1) was obtained from the PPI network using molecular complex detection (D). Kaplan–Meier survival curves for overall survival as a function of expression of Aurora A in patients with breast cancer (E).
Abbreviations: N, normal; T, tumor; BLCA, bladder urothelial carcinoma; BRCA, breast invasion carcinoma; CHOL, cholangiocarcinoma; COAD, colon adenocarcinoma; ESCA, esophageal carcinoma; GBM, glioblastoma multiforme; HNSC, head and neck squamous cell carcinoma; KICH, kidney chromophobe; KIRC, kidney renal clear cell carcinoma; KIRP, kidney renal papillary cell carcinoma; LGG, brain lower grade glioma; LIHC, liver hepatocellular carcinoma; LUAD, lung adenocarcinoma; LUSC, lung squamous cell carcinoma; PAAD, pancreatic adenocarcinoma; PRAD, prostate adenocarcinoma; READ, rectum adenocarcinoma; STAD, stomach adenocarcinoma; THCA, thyroid carcinoma; UCEC, uterine corpus endometrial carcinoma.
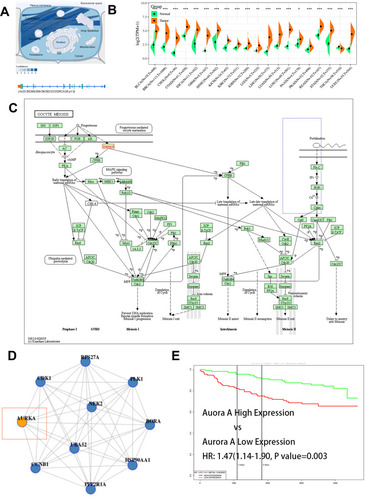
Table 3 Correlation Between Aurora A Expression and Other Biomarkers by Spearman Coefficient Analysis in Obesity Patients with Early Breast Cancer