Figures & data
Table 1 Characteristics of the Included Studies
Figure 1 The flow diagram of relevant studies from the electronic databases.
Abbreviations: CNKI, China National Knowledge Infrastructure; MALAT1, metastasis-associated lung adenocarcinoma transcript 1.
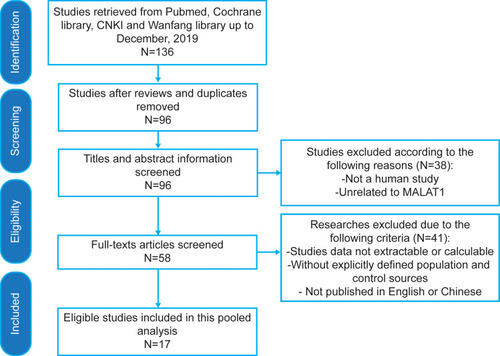
Table 2 Study Quality of the Diagnostic Studies Judged by the QUADAS II Checklist
Figure 2 Forest plots of pooled sensitivity and specificity of 17 included studies.
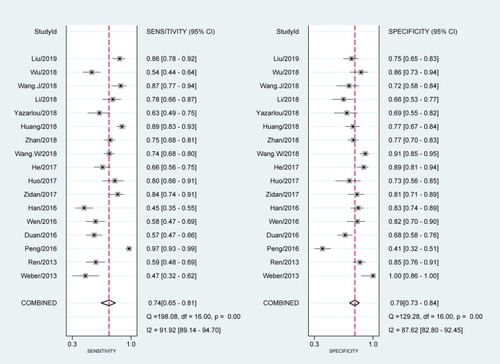
Figure 3 Forest plots of positive likelihood ratio (PLR) and negative likelihood ratio (NLR) for MALAT1 in the diagnosis of cancer.
Abbreviation: DLR, diagnostic likelihood ratio.
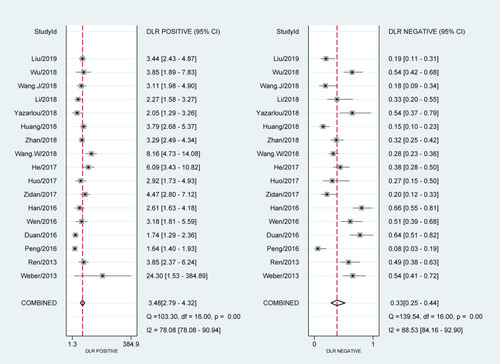
Figure 4 Forest plots of pooled diagnostic score (DS) and diagnostic odds ratio (DOR) for MALAT1 in the diagnosis of cancer.
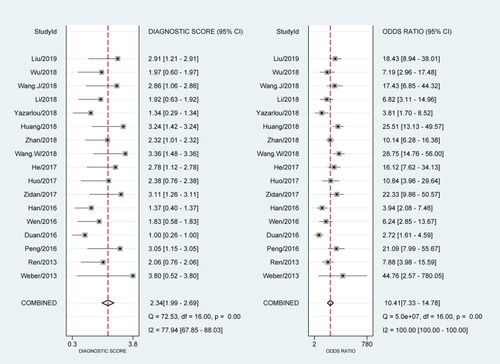
Figure 5 Summary receiver operating characteristic (SROC) graph of 17 included studies.
Abbreviations: SENS, sensitivity; SPEC, specificity; AUC, area under curve.
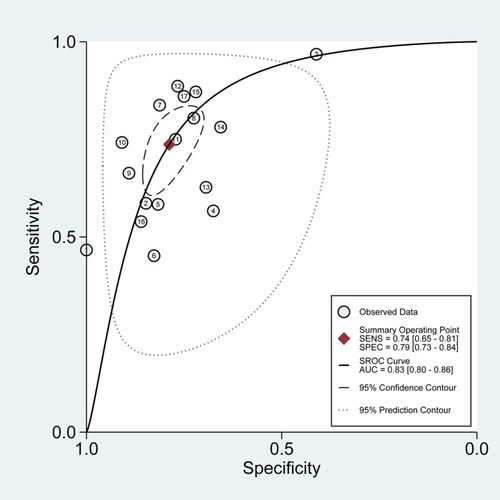
Figure 6 Hierarchical summary receiver operating characteristics (HSROC) curve for MALAT1 in the diagnosis of cancer.
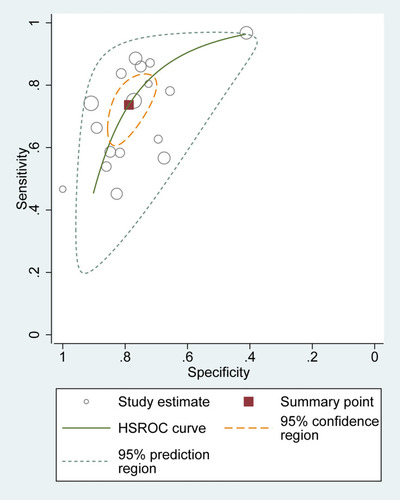
Figure 7 Fagan’s Nomogram for calculation of posttest probabilities.
Abbreviation: LR, likelihood ratio.
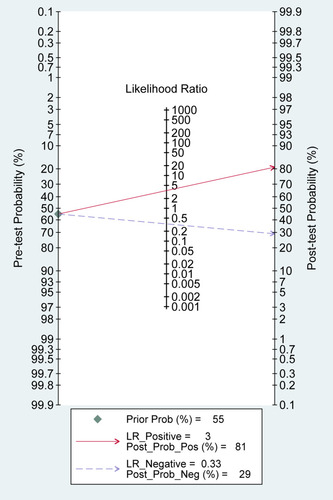
Figure 8 Graphs for sensitivity analysis: (A) goodness of fit, (B) bivariate normality, (C) influence analysis, and (D) outlier detection.
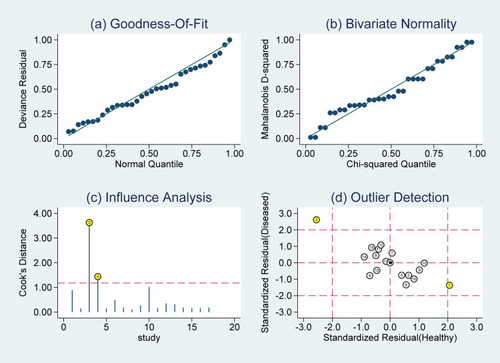
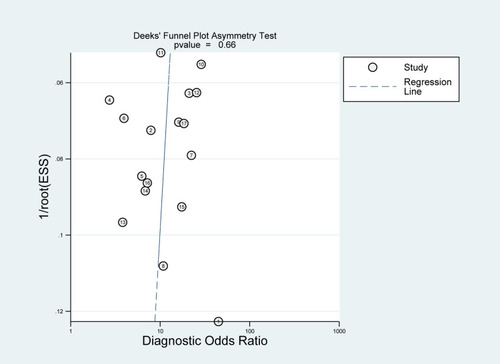
Figure 9 Graph of Deeks’ funnel plot asymmetry test.