Figures & data
Table 1 Correlations Between KIAA1522 Expression and Clinical Characteristics in HCC Patients (n = 60)
Figure 1 KIAA1522 is overexpressed in HCC. (A) KIAA1522 expression in HCC and normal tissues is analyzed using TCGA data. (B) KIAA1522 expression in HCC and normal tissues is obtained from the GEPIA database. (C) qRT-PCR results of KIAA1522 expression in HCC and corresponding non-tumor tissues. (D) Western blotting results of KIAA1522 protein expression in six pairs of tumor tissues (T) and corresponding non-tumor tissues (N). (E) IHC staining of KIAA1522, derived from HCC and corresponding non-tumor tissues. (F) qRT-PCR results of KIAA1522 expression in L02 cells and seven HCC cell lines. (G) Expression level of KIAA1522 protein in seven HCC cell lines and L02 cells (Western blotting). (H and I) Kaplan-Meier analysis of the association of KIAA1522 with overall survival and recurrence-free survival rates in patients with HCC using the GEPIA database. *P <0.05, **P <0.01, ***P <0.001.
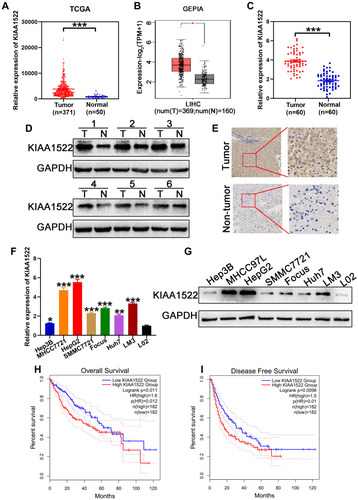
Figure 2 KIAA1522 promotes proliferation, migration, and invasion of HCC cells. (A and B) Knockdown and overexpression efficiencies of KIAA1522 are confirmed by qRT-PCR and Western blotting, respectively. (C) The association of KIAA1522 with PCNA is analyzed using the GEPIA database. (D–H) Proliferation of cell lines with knocked down or overexpressed KIAA1522 is assessed using CCK-8, colony formation, and EDU assays. (I and J) Migration of cell lines with knocked down or overexpressed KIAA1522 is detected using wound healing assays. (K and L) Migration and invasion of cell lines with knocked down or overexpressed KIAA1522 is determined using transwell assays. **P <0.01, ***P <0.001.
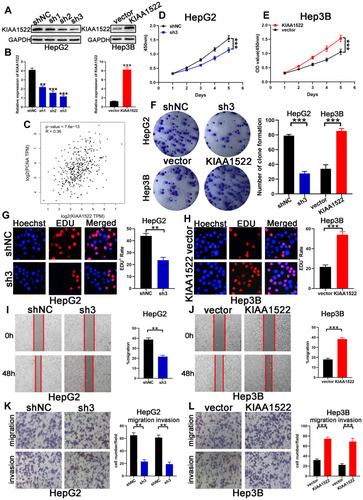
Figure 3 KIAA1522 overexpression inhibits apoptosis and reduces the G0/G1 cell cycle arrest in HCC cells. (A) Flow cytometry analysis of apoptosis of cell lines with knocked down or overexpressed KIAA1522. (B) Apoptosis-related proteins are measured using Western blotting. (C) Flow cytometry analysis of the cell cycle of cell lines with knocked down or overexpressed KIAA1522. (D) The expression of checkpoint proteins in the G1/S phase is measured using Western blotting. *P <0.05, **P <0.01, ***P <0.001.
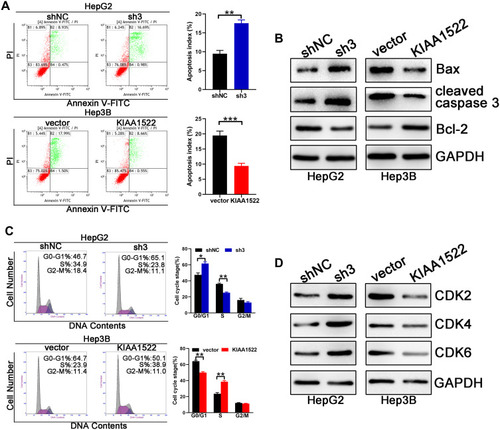
Figure 4 KIAA1522 contributes to HCC growth and metastasis in vivo. (A and B) Representative images of xenograft HCC tumors obtained from mice injected with HepG2-sh3 and -shNC or Hep3B-KIAA1522 and -vector. (C and D) Tumor growth curves of the experiments shown in (A and B). (E and F) Weight of the xenograft HCC tumors. (G–I) Representative images of the xenograft HCC tumors stained with anti-KIAA1522, anti-Ki-67, and anti-TUNEL antibodies. (J) Representative bioluminescence imaging of the tail vein injection mouse model. (K) The number of mice with pulmonary metastases is shown in the table. (L) Representative images of lung metastatic nodules that are stained with HE in the mouse model. *P <0.05, **P <0.01, ***P <0.001.
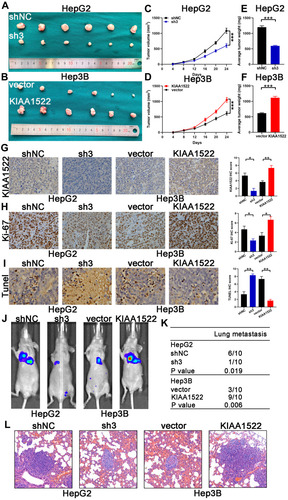
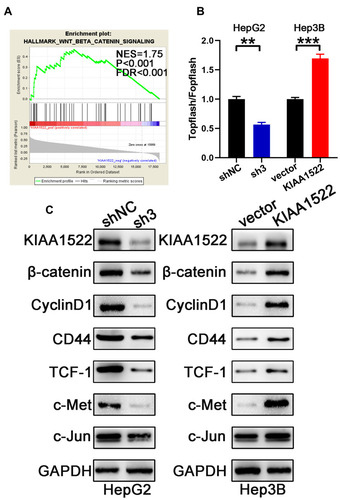
Figure 5 KIAA1522 activates the Wnt/β-catenin signaling pathway. (A) GSEA is performed using TCGA data to analyze the signaling pathways that are affected by KIAA1522. (B) TOP-flash/FOP-flash luciferase activity was measured in HepG2 and Hep3B cells. (C) The expression levels of several key proteins involved in the Wnt/β-catenin signaling pathway are detected using Western blotting. **P <0.01, ***P <0.001.