Figures & data
Table 1 Sequences Used for qRT-PCR
Figure 1 PPAT was highly expressed in TC tissues and cells. (A) We used IHC to detect the expression of PPAT protein in tissue samples from 50 TC patients and 50 normal thyroid tissues. (B) qRT-PCR was used to detect the expression of PPAT mRNA in TC tissues and normal thyroid tissues. (C) qRT-PCR was used to detect PPAT mRNA expression in normal thyroid follicular epithelial cells and TC cells. (D) Western blot was used to detect PPAT protein expression in normal thyroid follicular epithelial cells and TC cells. (E) The relationship between the expression of PPAT and the prognosis of TC patients was analyzed by GEPIA database. The experimental results were analyzed by Student’s t-test, and the difference was statistically significant with P < 0.05. **P < 0.01 and ***P < 0.001.
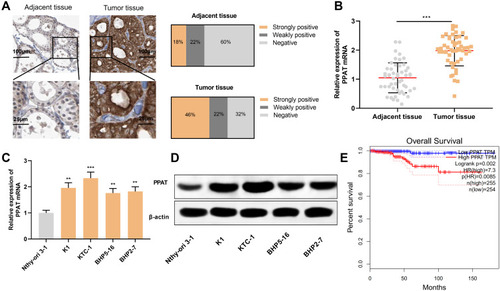
Table 2 Correlation Between PPAT Expression and Clinical Features of TC Patients (N = 50)
Figure 2 PPAT promoted TC cell proliferation, migration and invasion. (A) Western blot was used to detect the expression of PPAT protein in TC cells after overexpression or knockdown of PPAT. (B) CCK-8 method was used to detect the proliferation of BHP5-16 and KTC-1 cells. (C and D) Transwell assay was used to detect the migration and invasion of BHP5-16 and KTC-1 cells. The experimental results were analyzed by Student’s t-test, and the difference was statistically significant with P < 0.05. *P < 0.05 and **P < 0.01.
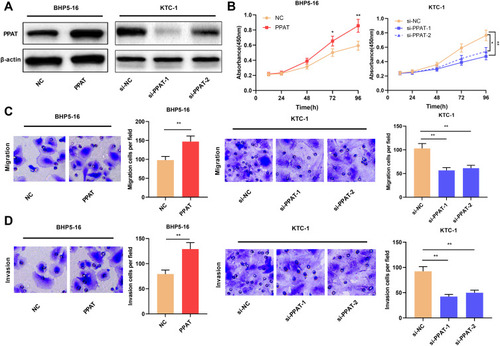
Figure 3 PKM2 expression was up-regulated in TC tissues and cells. (A) GEPIA database was used to analyze the expression of PKM2 in TC tissues. (B) Immunohistochemistry was used to detect the expression of PKM2 protein in tissue samples from TC patients and normal thyroid tissues. (C) qRT-PCR was used to detect the expression of PKM2 mRNA in TC tissues and normal thyroid tissues. (D) qRT-PCR was used to detect PKM2 mRNA expression in normal thyroid follicular epithelial cells and TC cells. (E) Western blot was used to detect PKM2 protein expression in normal thyroid follicular epithelial cells and TC cells. The experimental results were analyzed by Student’s t-test, and the difference was statistically significant with P <0.05. **P < 0.01 and ***P < 0.001.
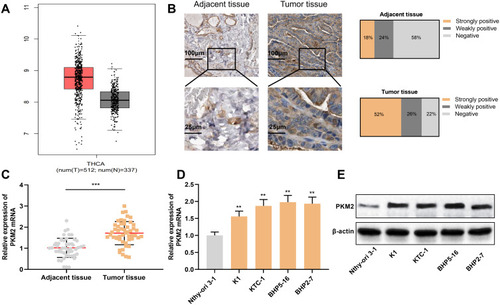
Figure 4 PKM2 promoted the proliferation, migration, and invasion of TC cells. (A) Western blot was used to detect the expression of PKM2 protein in TC cells after overexpression or knockdown of PKM2. (B) CCK-8 method was used to detect the proliferation of BHP5-16 and KTC-1 cells after overexpressing or knocking down PKM2. (C and D) Transwell assay was used to detect BHP5-16 and KTC-1 cell migration and invasion after overexpressing or knocking down PKM2. The experimental results were analyzed by Student’s t-test, and the difference was statistically significant with P <0.05. *P < 0.05, **P < 0.01, and ***P < 0.001.
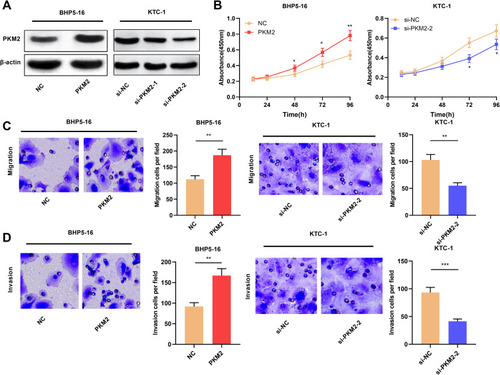
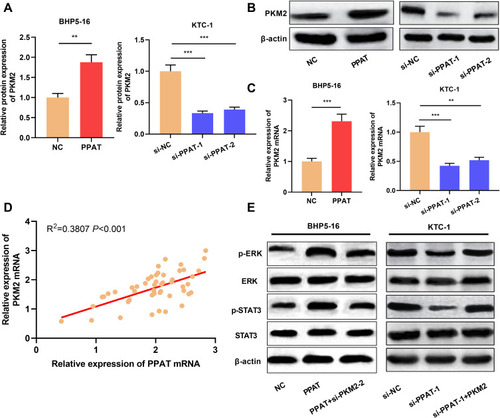
Figure 5 PPAT activated ERK and STAT3 signaling pathway by up-regulating PKM2 expression. (A and B) Western blot was used to detect the expression of PKM2 protein in BHP5-16 and KTC-1 cells after overexpression or knockdown of PPAT. (C) qRT-PCR was used to detect the expression of PKM2 mRNA in BHP5-16 and KTC-1 cells after overexpression or knockdown of PPAT. (D) qRT-PCR was used to detect the correlation between PPAT mRNA and PKM2 mRNA expression in TC tissue. (E) Western blot was used to detect the p-ERK, ERK, p-STAT3, and STAT3 after PPAT and PKM2 were modulated in TC cells. The experimental results were analyzed by Student’s t-test, and the difference was statistically significant with P <0.05. **P < 0.01 and ***P < 0.001.