Figures & data
Table 1 The Information of Clinicopathologic Patients
Figure 1 Crocin inhibited the proliferation and gene expression in gastric adenocarcinoma AGS cells. (A) Inhibition of AGS cells proliferation by treatment of different does of crocin (2.0 mg/mL, 4.0 mg/mL, 6.0 mg/mL) for 48 hours. (B) mRNA level of the 23 significantly downregulated genes was confirmed by qRT-PCR after the AGS cells treated with crocin (2.4 mg/mL, the IC50 concentration of crocin) for 48 hours. Relative mRNA level was calibrated by the mRNA level in the control group. (C) TPM4 expression was detected in the HGC-27 cells treated with crocin (2.0 mg/mL, 4.0 mg/mL, 6.0 mg/mL) by Western blot. (D) Inhibition of HGC-27 cells proliferation by treatment of different does of crocin (2.0 mg/mL, 4.0 mg/mL, 6.0 mg/mL) for 48 hours. Data were presented as the mean±SD. n=3. ***P<0.001 vs Control group.
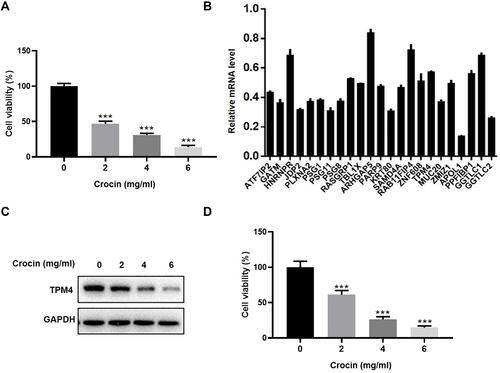
Figure 2 The expression of TPM4 in gastric carcinoma tissues (Tumor) or para-carcinoma tissues (Normal) was verified by qPCR or Western blot. (A) The expression of TPM4 was assessed in gastric carcinoma and para-carcinoma tissues (n=50). (B) Western blot was applied to detect the expression level of TPM4 in cancer tissues and para-carcinoma. (C) Histogram of the TPM4 protein quantification in E normalized to GAPDH. (D) AGS cells were treated with crocin (2.4 mg/mL) for 48 hours after transfecting with TPM4 for 24 hours, the cell viability was measured by CCK-8 assay (n=6). Data are presented as the mean±SD.
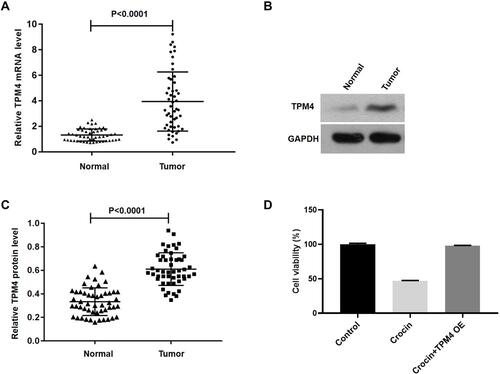
Figure 3 Knockdown of TPM4 inhibited AGC cell proliferation. (A) The stable shTPM4 AGS cells and shCtrl AGS cells were used to detect the mRNA level by qRT-PCR. (B and C) TPM4 protein expression in the stable shTPM4 AGS cells and shCtrl AGS cells were detected by Western blot. The cell proliferation was measured by Celigo image cytometry (D) and CCK-8 assay (E). (F and G) Cell clone formation assay was performed by using crystal violet staining. (H and I) Proliferating cell nuclear antigen (PCNA) protein expression in the stable shTPM4 AGS cells and shCtrl AGS cells was detected by Western blot. (J and K) Apoptosis of the stable shTPM4 AGS cells and shCtrl AGS cells was detected by flow cytometry. (G, I, and K) were histograms of (F, H, and J), respectively. Mean levels (±SD) were calculated from three replications. **P<0.01.
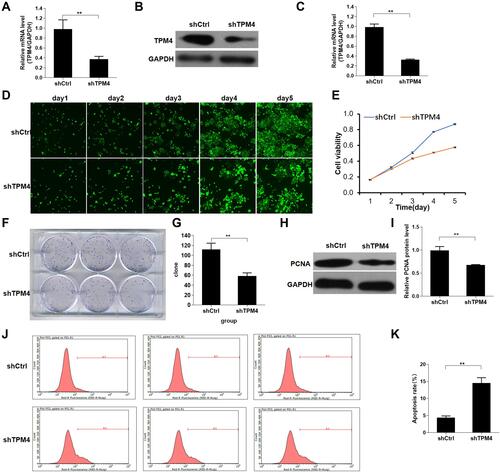
Figure 4 Knockdown of TPM4 inhibited the xenograft growth in nude mice. (A) Whole-body fluorescent imaging system showed the size of tumor in nude mice of the control group. (B) Whole-body fluorescent imaging system showed the size of tumor in nude mice of the TPM4 knockdown group. (C) The fluorescence degree of the tumor. (D) The tumor volume of shCtrl and shTPM4 mice. (E) The mice were sacrificed and the tumors were isolated. (F) The weight of the isolated tumor of the two groups (n=10). Data were presented as the mean±SD.
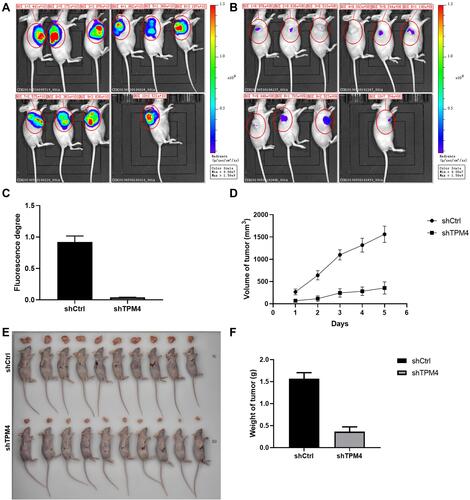
Figure 5 Differentially expressed genes between TPM4-RNAi AGS cells and control AGS cells were assessed by microarray detection. (A) Volcano Plot demonstrated the distribution of the differentially expressed genes between TPM4-RNAi AGS cells and control AGS cells. Horizontal coordinates represented the difference multiple with the logarithm conversion based on two and the ordinate represented the significant FDR of the difference with the logarithm conversion based on 10. The red color represents all the probes with fold difference >1.3 and FDR<0.05. Gray dots are genes with no significant differences. (B) Gene-wise hierarchical clustering heat map exhibiting the expression of genes with fold difference >1.3 and FDR <0.05. Each column represents one sample, and each row represents a differentgene. The upper tree structure was the aggregation or classification of all samples according to the expression profile of differentgenes. The tree structure on the left indicates the aggregation of expression patterns of differentially expressed genes. The red color demonstrates the up-regulated genes; the green color indicates the down-regulated genes. The black color displays the genes with no significant change, and the gray shows non-detected. E8921-1, E8921-2, and E8921-3 were the control group, while E8922-1, E8922-2, and E8922-3 were the TPM4-RNAi group.
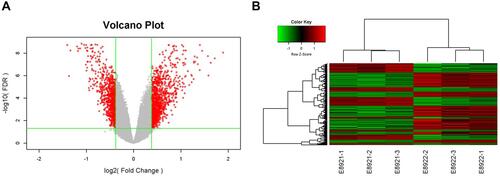
Figure 6 The molecular network of inhibition of proliferation and promotion of apoptosis caused by down-regulated TPM4. (A) The network displayed interactions genes related to cell proliferation and apoptosis that were differentially expressed in TPM4-RNAi AGS cells compared to the control group. Genes up-regulated in TPM4-RNAi AGS cells were colored in shades of red; genes in green were down-regulated. Solid and dashed lines indicate direct and indirect interactions, respectively. The regulators are colored by their predicted activation state: activated (orange) or inhibited (blue). Pointed arrowheads represent that the downstream node was expected to be activated if the upstream node connected to it was activated, while blunt arrowheads demonstrate that the downstream node is expected to be inhibited if the upstream node that connects to it is activated; and the grey lines indicate no predicted effects. (B) The expression of down-regulated genes was confirmed by Western blot, including EGFR, PTGS2, CXCL8, and RB1. GAPDH served as an internal control.
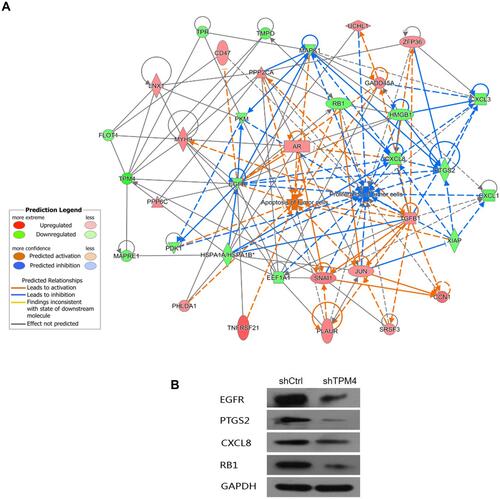
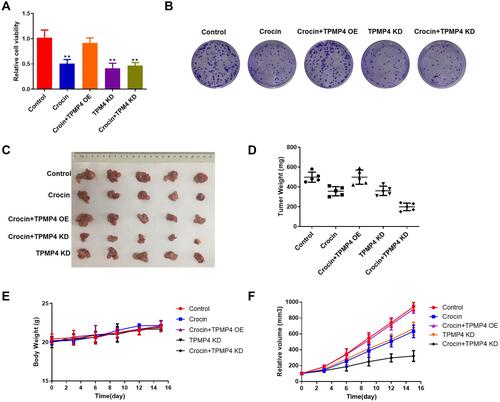
Figure 7 The knockdown of TPM4 weakened the inhibitory effect of crocin on gastric cancer cells and a xenotransplanted tumor model. AGS cells overexpressed or knocked down TPM4 treated with crocin (6 mg/mL) or not. (A) The cell viability was measured by using CCK-8. (B) Cell clone formation was assayed by using crystal violet staining. We used TPM4 knockdown AGS cells or TPM4 overexpression AGS cells to construct a xenotransplanted tumor model with intraperitoneal injection of crocin (6.25 mg/kg/day). (C) The photo of the isolated tumor was shown in the indicated group. (D) The weight of the tumors was measured. (E) The change of the body weight of mice. (F) The volume of the tumor was recorded every 3 days. Mean levels (±SD) were calculated from three replications. **P<0.01.