Figures & data
Figure 1 MBD2 expression is upregulated in RCC cells and tissues. (A) The protein expression of MBD2 was determined in the several human RCC cell lines (Caki-1, Caki-2, 769-P, 786-O and ACHN) and human normal tubular epithelial cell line (HK-2) by Western blotting. (B) The expression levels of MBD2 in KIRC (Kidney renal clear cell carcinoma; (T) and adjacent normal (N) tissues from TCGA and GTEx data were analyzed by excavating the online server GEPIA (http://gepia.cancer-pku.cn/detail.php?gene=MBD2). (C) MBD2 protein levels in 6 representative pairs of RCC (T) and adjacent normal (N) tissues were presented in the immunoblot. (D) The representative IHC staining of MBD2 in RCC and normal renal tissues. Original magnification, × 400. Data represents the means ± SD. *P < 0.05; **P < 0.01; ***P < 0.001.
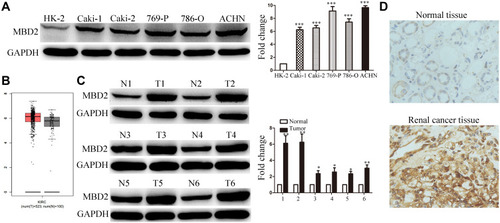
Table 1 The Correlations Between Expression and Clinicopathologic Characteristics in RCC Patients
Table 2 Univariate and Multivariate Cox Analyses of Prognostic Markers for OS in RCC Patients
Table 3 Univariate and Multivariate Cox Analysis of Prognostic Markers for DFS in RCC Patients
Figure 2 MBD2 expression is associated with poor survival in RCC patients. (A and B) The high expression of MBD2 predicts the poor overall and disease-free survival in RCC patients through analyzing data from GEPIA. (C and D) The Kaplan–Meier analysis of overall and disease-free for 109 RCC patients was shown based on quantitative IHC staining of MBD2.
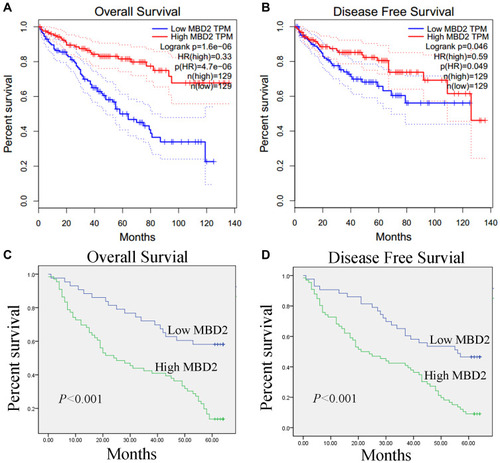
Figure 3 MBD2 promotes the proliferation of RCC cells. (A) The protein expression of MBD2 was determined by Western blotting in the 786-O and ACHN cells transfected with MBD2 plasmid or siRNA. (B and C) The effects of MBD2overexpression or knockdown on 786-O and ACHN cells as performed by CCK-8 assays. (D and E) Cell cycle distributions were analyzed by flow cytometry in 786-O and ACHN cells, and the percentage of cell population were presented in the histograms. (F and G) The Western blot analysis of the expression of P21, P27 and Cyclin D1 in 786-O and ACHN cells. Data represents the means ± SD. *P < 0.05; **P < 0.01; ***P < 0.001.
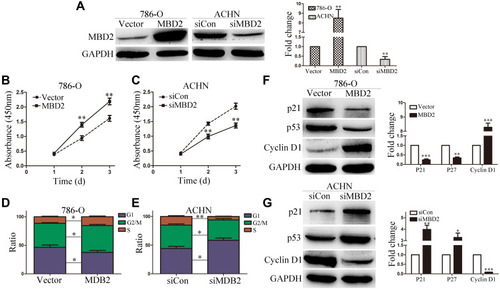
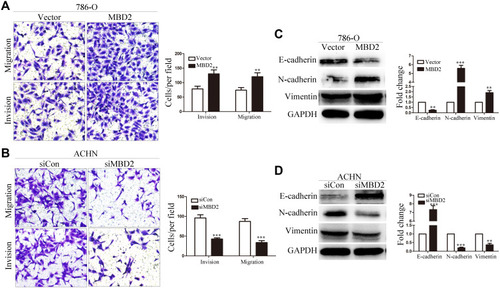
Figure 4 MBD2 promotes the migration and invasion of RCC cells. (A and B) The effect of MBD2 on cell migration and invasion was examined in 786-O and ACHN cells after MBD2 was re-expressed or knocked down, respectively. (C and D) The Western blot analysis for the protein expression of indicated EMT molecules (E-cadherin, N-cadherin and Vimentin) in 786-O and ACHN cells. Data represents the means ± SD. **P < 0.01; ***P < 0.001.