Figures & data
Figure 1 PT suppresses the proliferation and migration of ESCC cells. (A) The chemical structure of PT (molecular formula C15H20O3, molecular weight 284.32); (B) CCK-8 analysis for Eca109 and KYSE-109 cells growth; (C) CCK-8 analysis for Het-1A growth; (D) Inhibitory effects of PT and DDP on Eca109 and KYSE-109 cells growth; (E) Colony-forming analysis for Eca109 and KYSE-510 cells; (F) Wound healing analysis for Eca109 and KYSE-510 cells migration. Data were represented as means ± SD, n = 3, *P < 0.05.
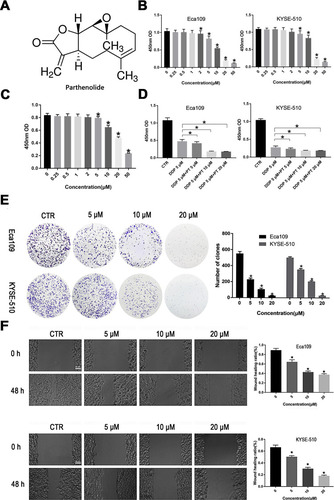
Figure 2 PT suppresses proliferation, migration, invasion and tube formation of HUVECs. (A) CCK-8 analysis for HUVECs proliferation; (B) Wound healing analysis for HUVECs migration; (C) Transwell Matrigel analysis for HUVECs invasion; (D) Tube formation analysis for HUVECs tube formation. Representative results and quantitative data of tube formation of HUVECs. All data were represented as means ± SD, n = 3, *P < 0.05.
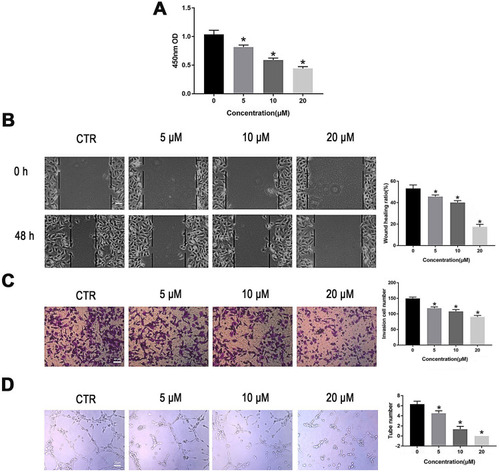
Figure 3 PT inhibits the expression of NF-κB, AP-1 and VEGF in ESCC cells. Western blot analysis for the determination of the expression of NF-κB, AP-1 and VEGF in (A) Eca109 and (B) KYSE-510 cells; ELISA analysis for the determination of the expression of VEGF in the culture medium of (C) Eca109 and (D) KYSE-510 cells; (E) Western blot analysis for the determination of the expression of NF-κB, c-Fos, c-Jun and VEGF in Eca109 cells treated with PT and/or TNF-α. Data were represented as means ± SD, n = 3, *P < 0.05.
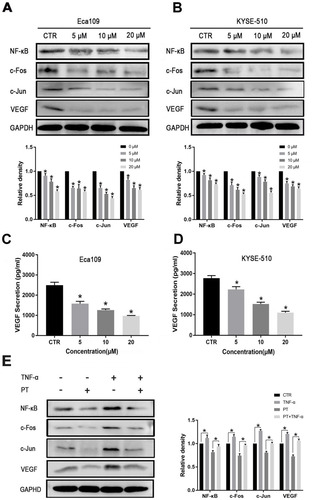
Figure 4 PT inhibited tumor growth in Eca109 ESCC subcutaneous xenograft tumor model. (A) Representative picture showing subcutaneous tumor-bearing nude mice of control and PT-treated group; (B) Changes in tumor volume of nude mice during treatment; (C) Changes in body weight of nude mice during treatment; (D) Representative images of HE staining for normal tissues (heart, liver, spleen, lung and kidney). Subcutaneous tumor-bearing nude mice were intraperitoneally injected with PT 4 mg/kg body weight, thrice a week for 4 weeks. Data were represented as means ± SD, n=6, *P < 0.05.
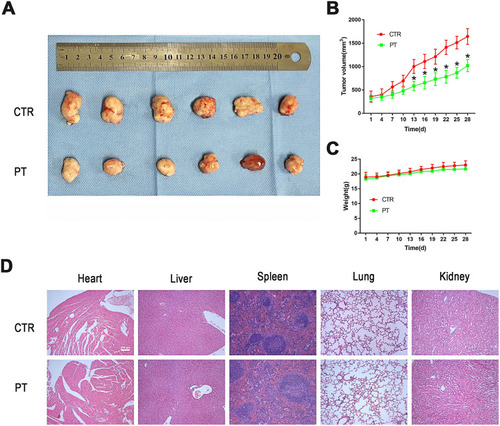
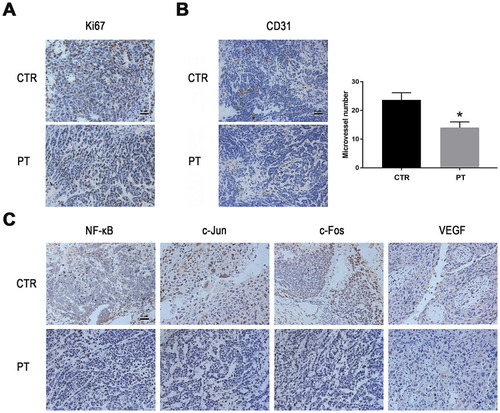
Figure 5 PT inhibits angiogenesis and down-regulates the expression of NF-κB, AP-1 and VEGF in vivo. (A) Representative images of IHC staining for Ki-67 in the xenograft tumors; (B) Representative images of IHC staining for CD31 in the xenograft tumors and the determination of the antiangiogenesis effects of PT; (C) Representative images of IHC staining for NF-κB, c-Fos, c-Jun and VEGF in the xenograft tumor model. *P < 0.05.