Figures & data
Figure 1 Flowchart of this study.
Abbreviations: CRT, chemoradiotherapy; GO, Gene Ontology; KEGG, Kyoto Encyclopedia of Genes and Genomes; PPI, protein–protein interaction; IHC, immunohistochemistry; FMUUH, Fujian Medical University Union Hospital; DFS, disease-free survival; ROC, receiver operating characteristics.
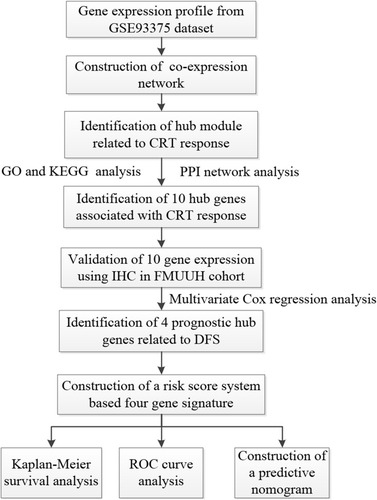
Figure 2 Weighted gene coexpression network analysis (WGCNA). (A) Dendrogram of all expressed genes in the top 25% of variance clustered based on a dissimilarity measure (1−TOM). (B) Heatmap plot of the adjacencies of modules. (C) Heatmap of the correlation between module eigengenes and CRT resistance.
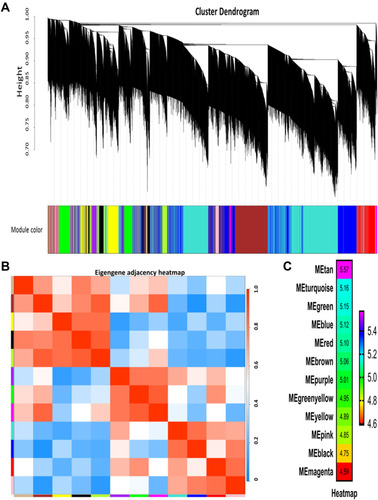
Figure 3 Identification of ten hub genes. (A) GO functional analysis of the top ten pathways of genes in tan modules. (B) KEGG pathway analysis of the top ten pathways of genes in tan modules. (C) PPI network of genes which has the highest score in the MOCDE in the tan module. The color intensity in each node was proportional to the degree of connectivity in the weighted gene co-expression network.
Abbreviations: GO, Gene Ontology; KEGG, Kyoto Encyclopedia of Genes and Genomes; PPI, protein–protein interaction; MCODE, Molecular Complex Detection.
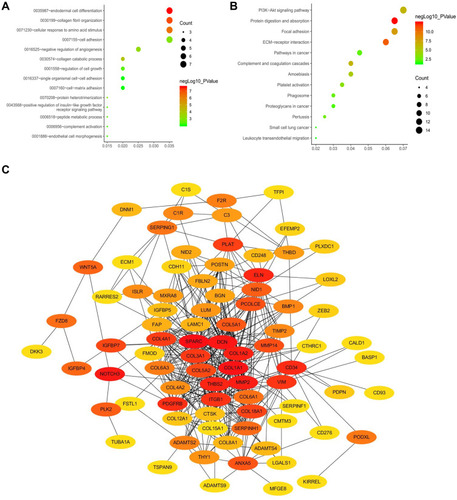
Figure 4 Association between the immunostaining expression of the ten hub genes of pCR. (A) The immunostaining expression of the ten hub genes between pCR and non-pCR groups. (B) ROC analysis of the immunostaining expression of NOTCH3, SPARC, and ITGB1 for predicting non-pCR of the training set. (C) ROC analysis of the immunostaining expression of DCN and COL15A1 for predicting pCR of the training set.
Abbreviations: ROC, receiver operating characteristic; pCR, pathological complete response.
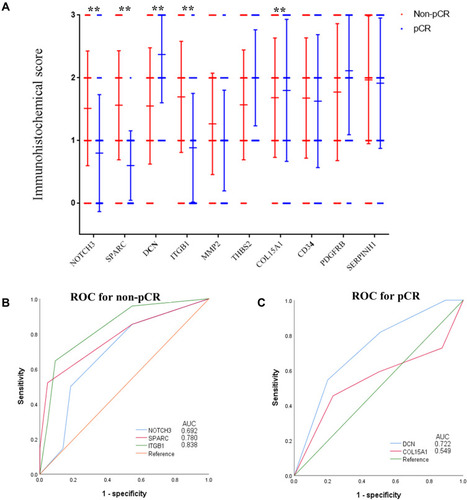
Figure 5 Identification of prognostic hub genes for DFS. (A) Univariate Cox regression analysis of predictors of DFS. (B) Multivariate Cox regression analysis of predictors of DFS. (C) Kaplan-Meier analysis of the ten hub genes.
Abbreviation: DFS, disease-free survival.
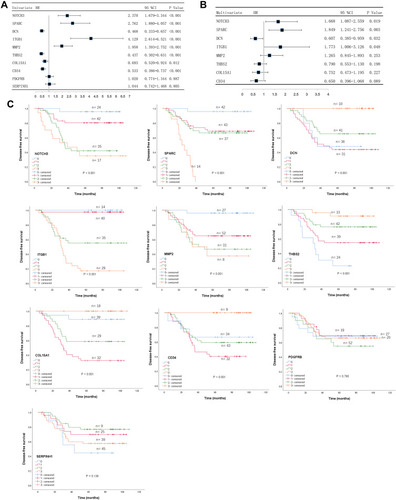
Figure 6 (A) The 4-gene-based risk score distribution, patient survival status; (B) Heatmap of the 4-gene expression profiles in the high-risk and low-risk subgroups for the training set. (C) Kaplan-Meier analysis of patients’ DFS in the high-risk (n = 59) and low-risk (n = 59) subgroups of the training set; (D) ROC analysis of the risk score for prediction the DFS of the training set.
Abbreviations: DFS, disease-free survival; ROC, receiver operating characteristic.
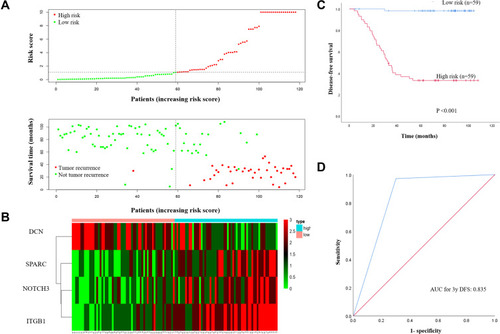
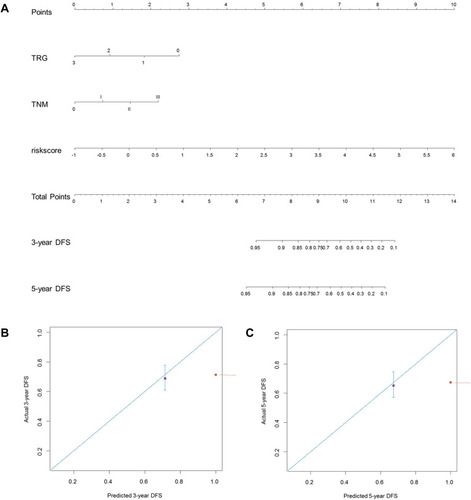
Figure 7 Construction of a predictive nomogram for DFS. (A) The predictive nomogram consisted of the risk score, TRG and ypTNM stage. (B) Calibration curve of the nomogram for estimation of DFS rates at 3-year. (C) Calibration curve of the nomogram for estimation of DFS rates at 5-year. DFS disease-free survival.