Figures & data
Figure 1 EGOT expression in rectal cancer tissues and cell lines. (A and B) Detection of EGOT expression in rectal cancer tissues and paired normal tissues by qRT-PCR (n = 50). (C) The expression of EGOT in rectal cancer cell lines. (D) Kaplan–Meier survival analysis of EGOT expression. N = 3. **p < 0.01.
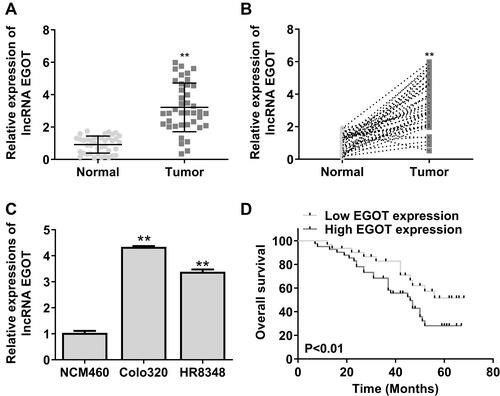
Figure 2 EGOT knockdown inhibited the growth of rectal cancer cells. (A) EGOT expression of siRNA EGOT-transfected Colo320 cells. (B) CCK-8 assay was used to assess cell viability. (C) Colony formation assay was used to assess cell colony formation. (D) Transwell was used to measure cell invasion and migration. (E) Flow cytometry was used to detect apoptosis. N = 3. **p < 0.01, ***p < 0.001.
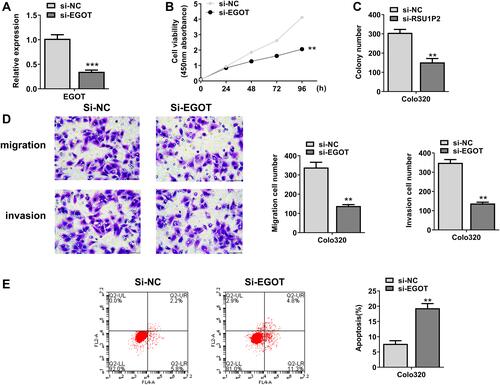
Figure 3 EGOT participated in radiotherapy for rectal cancer and affected radiosensitivity. (A) Expression level of EGOT in Colo320 cells. (B) CCK-8 was used to evaluate cell viability. (C) Colony formation test was used to evaluate the number of cell colonies formed. (D) Apoptosis was detected by flow cytometry. *p<0.5, **p < 0.01, ***p < 0.001.
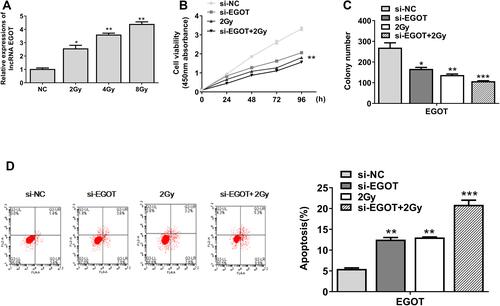
Figure 4 MiR-211-5p was a target of EGOT. (A) miR-211-5p was predicted to be a target gene of EGOT. (B) Fluorescein enzyme activity analysis in cells co-transfected with EGOT-WT or EGOT-Mut vectors. (C) Immunoprecipitation test was used to determine the enrichment of EGOT and miR-211-5p in the immunoprecipitation complex. Anti-immunoglobulin G was used as a control. (D) Expression level of miR-211-5p in EGOT-knockout Colo320 cells. (E) Expression level of miR-211-5p in rectal cancer tissue. (F) Pearson correlation analysis of miR-211-5p and EGOT in rectal cancer tissue (n = 40). N = 3. **p < 0.01.
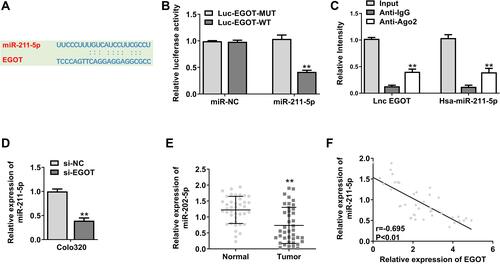
Figure 5 EGOT affected the progression of rectal cancer through the miR-211-5p/ErbB4 axis. (A) ErbB4 was predicted to be a target gene of miR-211-5p. (B) Analysis of luciferase activity in cells co-transfected with ErbB4-WT or ErbB4-Mut vectors. (C) ErbB4 mRNA expression level in Colo320 cells. (D) ErbB4 protein expression level in Colo320 cells. (E) ErbB4 expression level in rectal cancer tissue. (F) Pearson correlation analysis of ErbB4 and miR-211-5p in rectal cancer tissue (n = 40). N = 3. **p < 0.01 vs miR-NC; #p < 0.05 vs miR-211-5p.
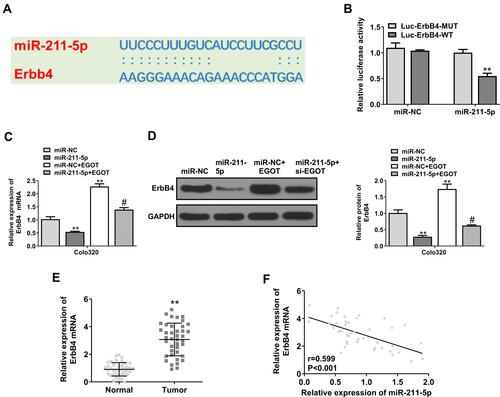
Figure 6 MiR-211-5p inhibitor restored the effect of EGOT knockdown on radiosensitivity. (A) Cell proliferation was evaluated by colony formation test. (B). Apoptosis was detected by flow cytometry. (C) Immunofluorescence detection of γ-H2AX (D and E). The protein levels of ErbB4. N = 3. *p < 0.05, **p < 0.01.
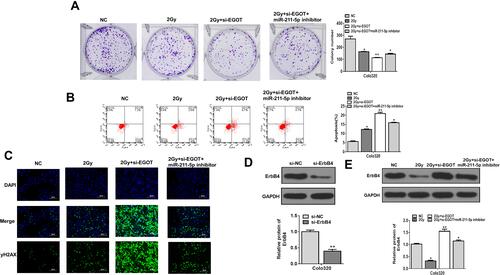
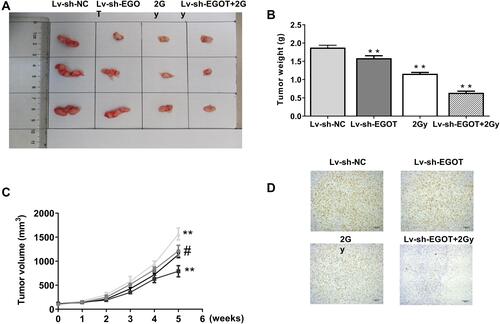
Figure 7 EGOT knockdown enhanced the radiosensitivity of rectal cancer. (A) Measurement of tumor volume in nude mice weekly. (B) Comparison of tumor weight in nude mice. (C) Representative images of three groups of subcutaneous tumors. (D) Ki67 staining. N = 5. **p < 0.01 vs Lv-sh-NC; #p < 0.05 vs Lv-sh- EGOT.