Figures & data
Table 1 Clinical Features of Patients with HCC and the Controls
Figure 1 Boxplots of serum VEGF and MMP-9 in healthy controls, EGFR-negative patients, and EGFR-positive patients. (A) Serum VEGF concentration in three different groups. (B) Serum MMP-9 concentration in three different groups. Fold change and P-values are listed in the order of control vs EGFR-positive patients, and EGFR-negative patients vs EGFR-positive patients.
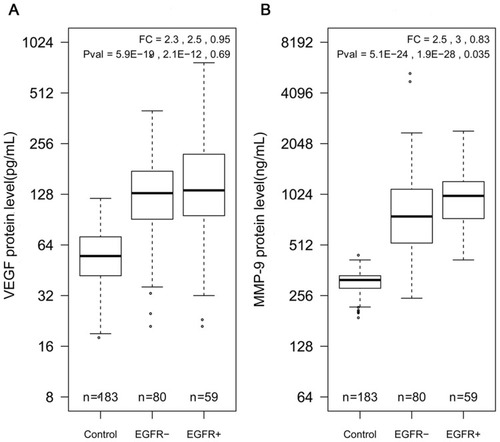
Table 2 Relation of Serum VEGF and MMP9 to Clinicopathological Characteristics of 139 Patients with HCC (Concentration Unit: VEGF, Pg/mL; MMP-9, Ng/mL)
Figure 2 Changes in serum VEGF and MMP-9 levels in patients with HCC after TACE therapy. Mean changes in serum (A) VEGF and (B) MMP-9 levels between recurrent and non-recurrent patients after TACE therapy. Mean changes in serum (C) VEGF and (D) MMP-9 levels between EGFR-negative and -positive patients after TACE therapy. Mean changes in serum (E) VEGF and (F) MMP-9 levels in patients with HCC after TACE therapy with different chemotherapeutic drugs relative to the pre-treatment value.
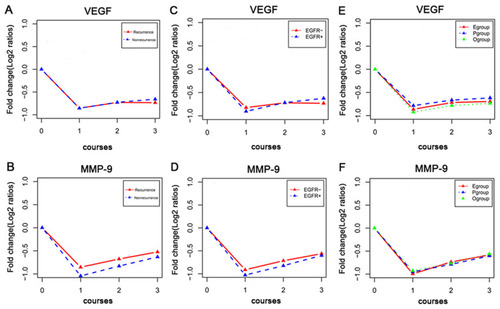
Figure 3 Boxplots of serum (A) VEGF and (B) MMP-9 levels in EGFR-negative and -positive patients after TACE therapy with chemotherapeutic drugs based on adriamycin and its isomers.
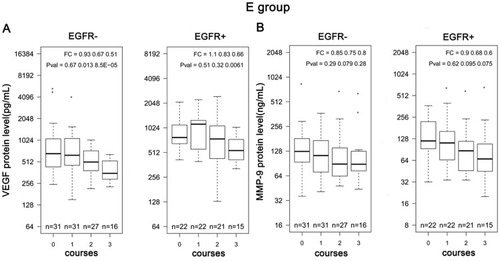
Figure 4 Boxplots of serum (A) VEGF and (B) MMP-9 levels in EGFR-negative and -positive patients after TACE therapy with chemotherapeutic drugs based on platinum.
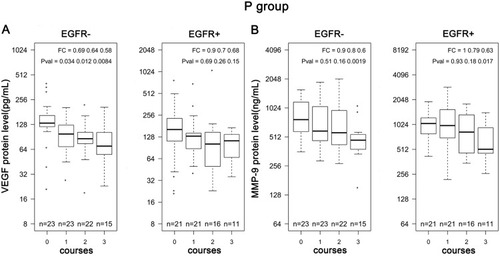
Figure 5 Boxplots of serum (A) VEGF and (B) MMP-9 levels in EGFR-negative and -positive patients after TACE therapy with chemotherapeutic drugs based on other drugs.
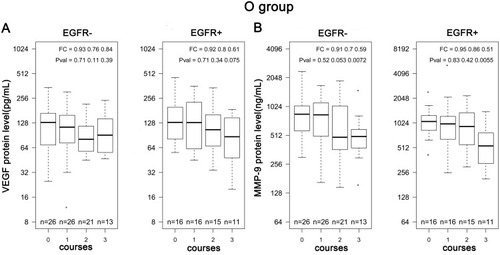
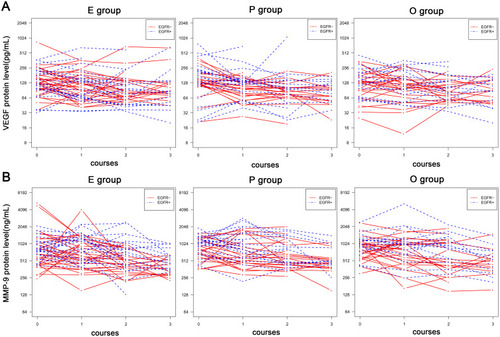
Figure 6 Longitudinal serum (A) VEGF and (B) MMP-9 in individual patients. Serum concentrations of VEGF and MMP-9 were plotted on the Y-axis and sampling time after therapy were plotted on the X-axis. Each dot represents a sample and different time points for the same patient is linked by a line.