Figures & data
Table 1 Clinical Data of the Patients
Table 2 Detected Genes
Figure 1 Summary of mutations (A) Most of the 68 individual somatic mutations were missense mutations, while multiple hit mutations accounted for 38% of KMT2C mutations, and frameshift mutations also accounted for 46.67% of ASXL1. Among the total mutation rates, the highest was ABL1 KD (31%), followed by that of KMT2C, FAT1 and ASXL1, which were 31%, 25% and 22%, respectively. (B) The coexistence relationship among genes is complicated. (C) The TKIs-resistant group accounted for the majority of the mutations in most genes, while the number of mutations in the TKIs-intolerant group in the CUX1, GATA2 and KIT genes was higher than those in the TKIs resistant group.
Abbreviations: KD, kinase domain; TKIs, tyrosine kinase inhibitors.
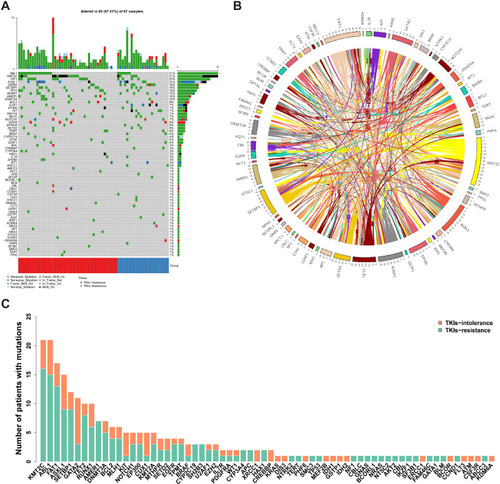
Table 3 Mutations Rates of Genes Related to MDS
Figure 2 Mutation rates of MDS related genes. Mutation rates of 20 genes related to MDS; Mutation rates of KIT, GATA2 and CUX1 in patients with TKIs intolerance were significantly higher than in TKIs-resistant group.
Abbreviation: MDS, myelodysplastic syndrome.
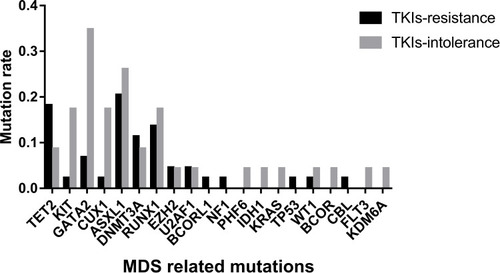
Figure 3 Mutation rates of genes with different functions. According to the function of genes, they were divided into chromatin modification (86.57%, 58/67), activated signaling (58.70%, 40/67), transcription factor (47.76%, 32/67), methylation (44.78%, 30/67), other (34.33%, 23/67), adhesion and cohesion complex (26.87%, 18/67), cell metabolism (16.42%, 11/67), tumor suppressor (8.96%, 6/67), spliceosome and RNA metabolism (5.97%, 4/67). It can be seen that the mutations rate in transcription factor is higher in patients intolerant to TKIs (82.60% vs 27.27%, P=0.016).
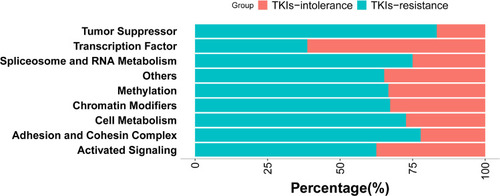
Table 4 Statistics on Mutation Rates of Additional Genes Associated with ABL KD
Table 5 Relationship Between ASXL1 Mutation and Clinical Features at Initial Diagnosis
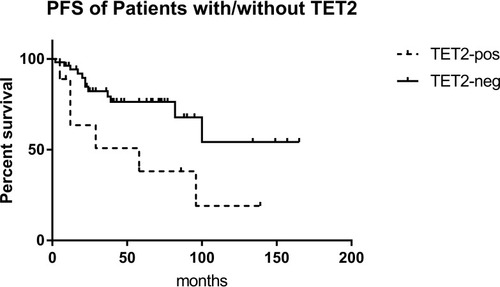
Figure 4 EFS of patients with/without TET2 mutation. In Kaplan-Meier analysis, the EFS of patients with TET2 mutation was significantly lower than those without (P=0.039).