Figures & data
Figure 1 Continued.
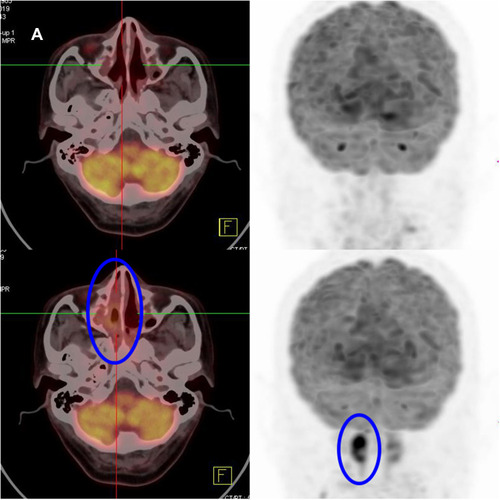
Figure 1 Comparison of PET-CT images before (July 2019) and after (November 2019) the PCET treatment in patient 1. (A) The value of standardized uptake value (SUV) of the mass (it can be seen in the blue coil) in the right nasal cavity was 5.0 in July 2019. In the upper part of the figure, we can see that the mass of the right nasal cavity was gone, and the SUV value of nasal mucosa reduced to 3.0 after 4 cycles of treatment. (B) The SUV value of the nasopharynx (it can be seen in the blue coil) was 25.2 in July 2019 before the PCET treatment. In the upper part of the figure, we can see that the nasopharyngeal metabolic value decreased significantly (SUV= 5.0) in November 2019. The inflammation of the nasal cavity and sinuses had also improved obviously in November 2019.
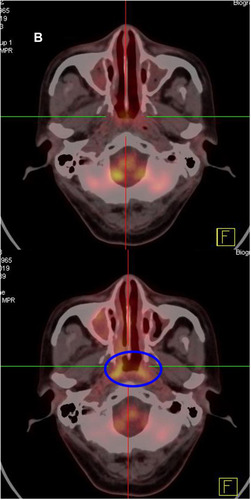
Figure 2 The MRI findings of case 2. (A) The swelling (it can be seen in the blue coil) in the left nasopharyngeal wall and rear of the tongue before receiving the PCET regimen. (B) The neoplasm (it can be seen in the blue coil) shrank obviously after 2 cycles completed.
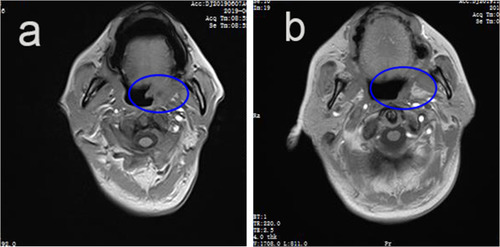
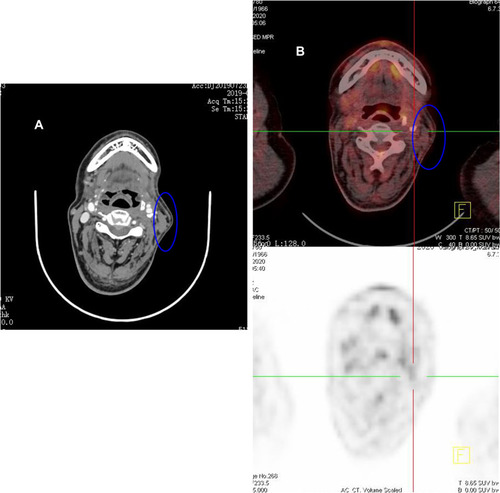
Figure 3 Imaging findings of case 3. (A) The enhanced CT of the last disease progression showed left cervical lymphadenopathy (it can be seen in the blue coil). It was considered disease of progress according to the pathological findings and the symptom of fever. (B) PET-CT showed no abnormal hypermetabolic foci in the original cervical lymph node (it can be seen in the blue coil) after 6 cycles of PCET treatment. It means that he achieved clinical CR.