Figures & data
Figure 1 TEMs increased in peripheral blood of CC patients. (A) Detection of cTEMs in the peripheral blood (flow cytometric analysis). (B) Representative images of immunofluorescence assays for CD14 (green) and Tie2 (red) expression in TEMs and TNegMs which were isolated by FACS. Cell nuclei were labeled with DAPI (blue). Both CD14 (green) and Tie2 (red) were expressed in TEMs, while only CD14 (green) was expressed in TNegMs. Scale bar, 20 μm. (C) The percentage of cTEMs (Tie+CD14+) in total CD14+ monocytes was detected in peripheral blood of 7 HV, 17 UF, 24 CIN II, 31 CIN III and 99 CC patients. (D) The percentage of cTEMs is significantly increased in CC patients (Mann–Whitney u-test). *P<0.05, ** P<0.01 and *** P<0.001. (E) Boxplot of the Jonckheere–Terpstra test for the trend of percentage of cTEMs changing with the severity of cervical lesions. P<0.001. (F) Representative images of immunofluorescence assays for CD14 (green) and Tie2 (red) expression in PBMCs of HV and CC patient. Cell nuclei were labeled with DAPI (blue). Scale bar, 20 μm.
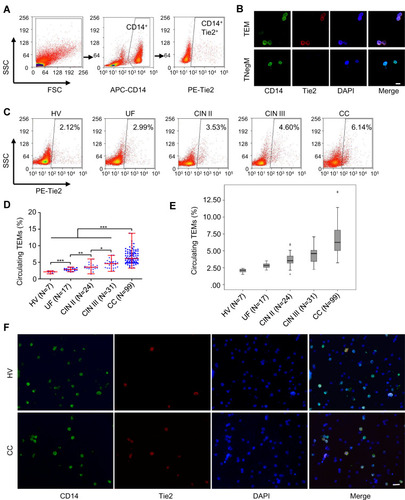
Figure 2 The diagnostic value of cTEM for cervical lesions. ROC analyses were performed in order to assess the diagnostic value of percentage of cTEMs for differentiating non-CC (HV, UF and CIN patients) from CC patients (A), HV, UF and CIN II from CIN III and CC patients (B), and for differentiating HV and UF from CIN and CC patients (C).
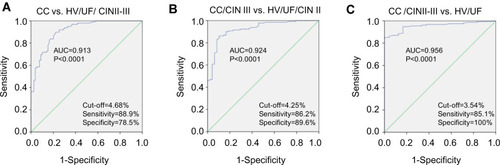
Table 1 The Relation of Circulating TEMs to Clinical-Pathological Parameters in Cervical Cancer
Figure 3 Percentage of cTEMs is correlated with CC progression. High level of cTEMs were significantly associated with FIGO stage (A), tumor size (B), deep stromal invasion (C), parametrial invasion (D), lymph-vascular space invasion (E) and LNM (F). ***P<0.001.
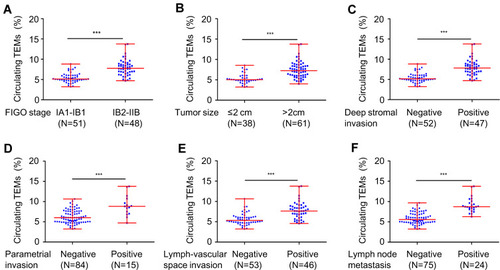
Table 2 Univariate Analysis and Multivariate Analysis of Lymph Node Metastasis in Patients with Cervical Cancer (N=99)
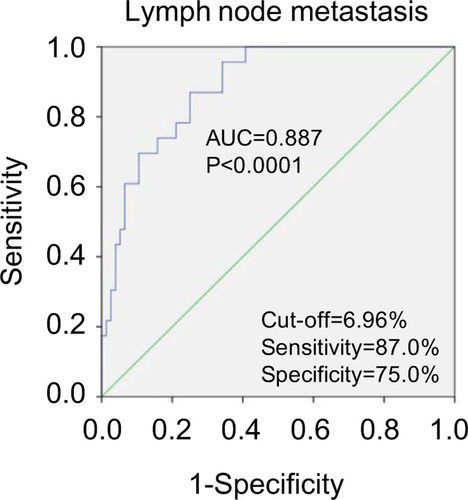
Figure 4 Percentage of cTEMs is an independent predictor of CC LNM.