Figures & data
Figure 1 Expression profile of circRNAs in GC and para-cancerous tissues. (A) Clustered heatmap. Each row represents one specimen, and each column represents one circRNA. The color scale reflects the log2 signal strength, from green (low intensity) to black (medium intensity) to red (high intensity). (B) Volcano plots. The red dots represent statistically significant up-regulated circRNAs, the green dots represent statistically significant down-regulated circRNAs. (C) 20 pairs of tissue samples to verify the up-regulation of circ_0004771 (n=20, P=0.0001). (D) Relative expression of circ_0004771 in GC cell lines. (E) Relative expression of circ_0004771 in plasma of initial 20 GC patients (n=20, P=0.0001). (F) A positive correlation of the relative expression of circ_0004771 between plasma and tissues in GC patients (P<0.01, R2=0.6706). (G) Expression level of circ_0004771 in culture supernatants of SGC-7901 increased with time compared to GES-1.
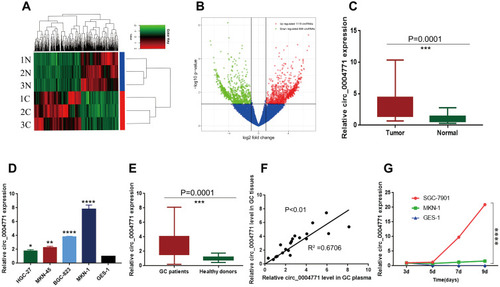
Figure 2 Identification of cyclic structure of circ_0004771. (A) Biogenesis of circ_0004771. (B) Identification of the cyclization site of circ_0004771 by Sanger sequencing. (C) Stability of circ_0004771 confirmed by Rnase R digestion assay. (D) Longer half-life of circ_0004771 verified by actinomycin D assay.
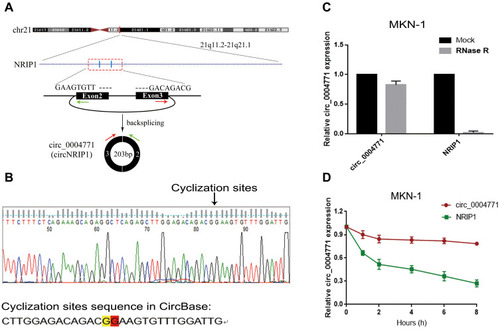
Table 1 The Intra-Assay Coefficient of Variation and the Inter-Assay Coefficient of Variation of Circ_0004771
Figure 3 Construction of the research model of circ_0004771. (A) Standard curve of circ_0004771 (R2=0.9983). (B and C) Intra-assay CV and inter-assay CV of circ_0004771 detection. Verify the accuracy and specificity of circ_0004771 by AGE (D) and melting curve (E). (F) Differential expression of circ_0004771 in the plasma of GC patients (n=120), superficial gastritis patients (n=40) and healthy donors (n=120).
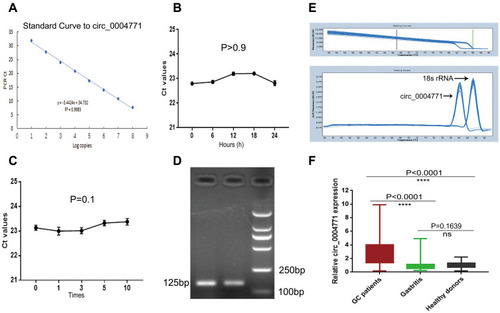
Figure 4 Potential of circ_0004771 to be a diagnostic biomarker. (A) ROC curve analysis of plasma circ_0004771 for discriminating primary GC patients and healthy donors (AUC=0.831). (B) The diagnostic efficacy of CEA (AUC=0.747). (C) The diagnostic efficacy of CA199 (AUC=0.508) (D) ROC curve analysis of plasma circ_0004771 for discriminating primary GC patients and gastritis patients (AUC=0.845). (E) Combined diagnostic efficacy of plasma circ_0004771, CEA and CA199 exerted the best diagnostic efficacy in distinguishing GC patients and healthy donors (AUC=0.864).
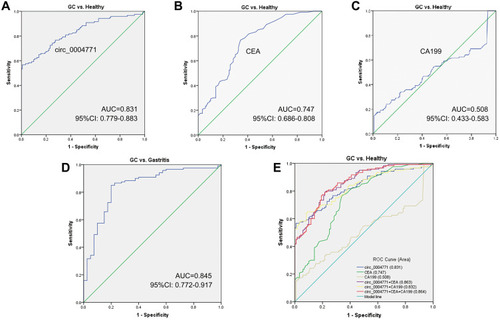
Table 2 Evaluation of the Diagnostic Values of Combination of Circ_0004771, CEA, CA199 Between GC Patients and Healthy Donors
Table 3 The Association Between Plasma Circ_0004771 Expression and the Clinicopathological Parameters in GC Patients
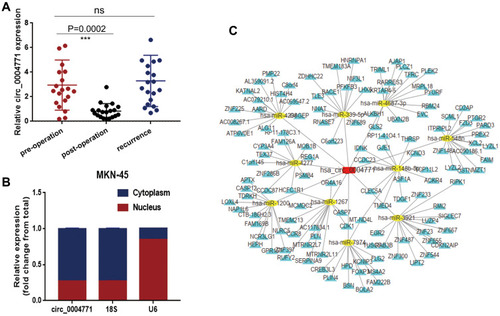
Figure 5 Dynamic monitoring and functional forecasting of circ_0004771. (A) Expression level of circ_0004771 in GC patients decreased after operation (n=20, P=0.0002) and increased after recurrence (n=20). (B) Detection of circ_0004771 location in MKN-45 cell line by nucleoplasm separation assay. (C) Prediction circRNA-miRNA-mRNA regulation network of circ_0004771. The red rectangle represents circ_0004771, and the yellow oval represents miRNAs which may bind to circ_0004771, while the yellow triangle represents the target mRNA of the corresponding miRNA.