Figures & data
Figure 1 (A) Relative mRNA expression of CXCLs in PC with reference to normal glans pool (NG) in GSE57955 dataset. (B) Waterfall plot of CXCL13 mRNA expression in PC with reference to normal glans pool (NG) in GSE57955 dataset (n=39). (C) Real-time PCR analysis on CXCL13 expression in PC and matched adjacent tissues (AT) (n=23). (D) The association between CXCL13 expression and HPV status in GSE57955 dataset.
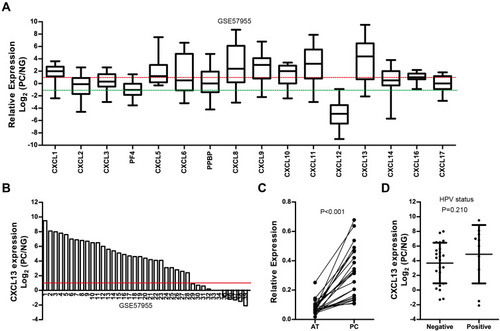
Table 1 Clinicopathologic Characteristics of PC Patient Cohort
Figure 2 (A) Serum CXCL13 level in preoperative PC cohort (n=76) and healthy male control (n=46). (B) ROC curve analysis on the diagnostic value of serum CXCL13 level in PC patients. (C) Serum CXCL13 level in the matched preoperative/postoperative PC cohort (n=18).
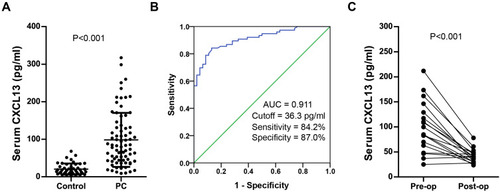
Figure 3 Association between preoperative serum CXCL13 level and clinical parameters in the PC cohort. (A) Age, (B) Phimosis, (C) BMI index, (D) Pathological grade, (E) Histological subtype, (F) T stage, (G) nodal status, (H) pelvic LNM.
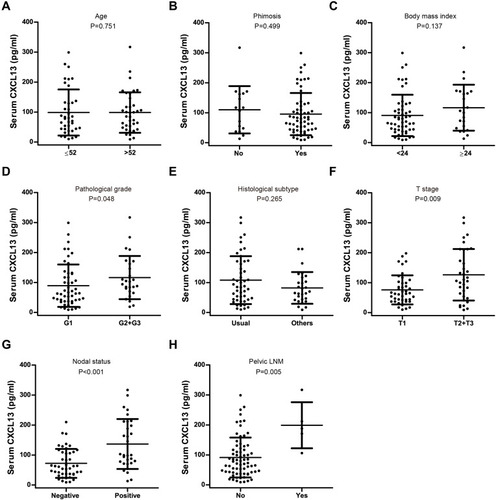
Figure 4 (A) ROC curve for preoperative serum CXCL13 level with reference to cancer recurrence. (B) PC patients with high preoperative serum CXCL13 level exhibited shorter disease-free survival.
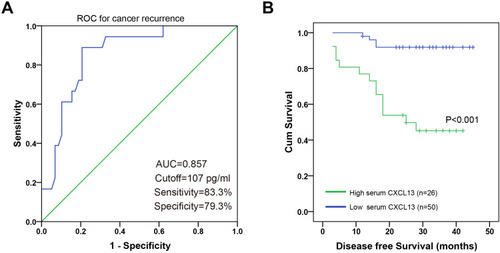
Table 2 Cox Univariate and Multivariate Proportional Hazard Model for Factors Affecting Disease-free Survival in PC Cases
Figure 5 (A) Expression of CXCL13 in normal penile tissues (NPT, n=36) and PC tissues (n=40). Representing micrographs showed CXCL13 expression in normal penile tissues and PC, respectively. Bars: 50 μm. *P<0.05, PC vs NPT. (B) Expression of CXCL13 in normal penile tissues (NPT1, NPT2) and PC cell lines. (C) CXCL13 level in culture supernatant of PC cell lines.
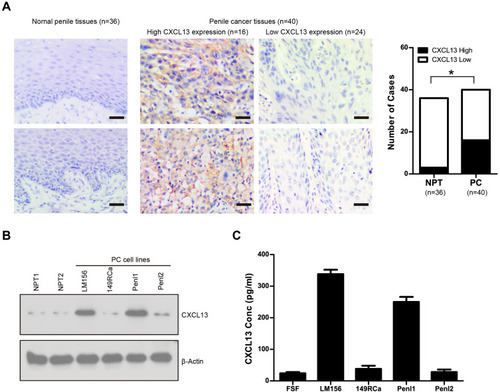
Figure 6 (A) Western blotting analysis on CXCL13 expression following shRNA-mediated knockdown in Penl1 and LM156 cells. (B) Depletion of CXCL13 expression suppressed cell growth of PC cells. The cell viability in the Scr control was regards as 100%. (C) Depletion of CXCL13 expression reduced clonogenesis of PC cells. The colony formed inthe Scr control was regards as 100%. n=3, *P<0.05. (D) Knockdown of CXCL13 induced caspase-3 activity in Penl1 and LM156 cells. The caspase-3 activity in the Scr control was regards as 100%. n=3, *P<0.05.
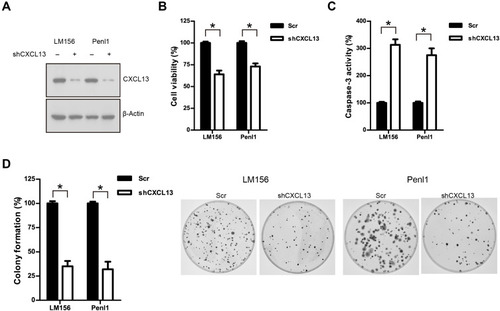
Figure 7 (A) Knockdown of CXCL13 expression inhibited cell migration of PC cells. Bars: 100 μm. The cell migration in the Scr control was regards as 100%. n=3, *P<0.05. (B) Knockdown of CXCL13 expression inhibited transwell invasion of PC cells. Bars: 50 μm. The cell invasion in the Scr control was regards as 100%. n=3, *P<0.05.
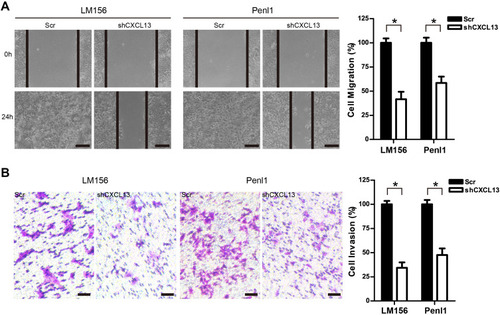
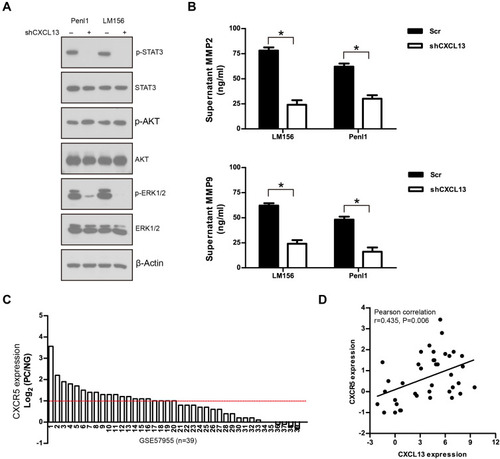
Figure 8 (A) Effect of CXCL13 depletion on cancer-related signaling pathways in PC cell lines. (B) Knockdown of CXCL13 reduced MMP2/9 secretion in PC cell lines. n=3, *P<0.05. (C) Waterfall plot of CXCR5 expression in PC dataset GSE57955 (n=39). (D) Correlated expression between CXCL13 and CXCR5 in PC dataset GSE57955 (n=39).