Figures & data
Figure 1 TAF9B promotes proliferation in OS cells. (A), TAF9B expression was detected using qPCR in hFOB 1.19, MG-63, and U2OS cells. The relative expression of TAF9B was normalized to the hFOB 1.19 group. (B), TAF9B overexpression plasmid was transfected into MG-63 cells (TAF9B group) with the empty plasmid as a negative control (NC group). The expression of TAF9B was detected by qPCR. (C), TAF9B siRNA was transfected into U2OS cells (si-TAF9B group) with the nonspecific siRNA as a control (si-con group). The expression of TAF9B was detected by qPCR. (D–F), The expression of TAF9B was further confirmed using Western blot assay. (G–H), Cell activity of each group was determined using CCK-8 assay. (I–K), Colony formation assay was performed to detect the proliferation of each group. **p<0.01.
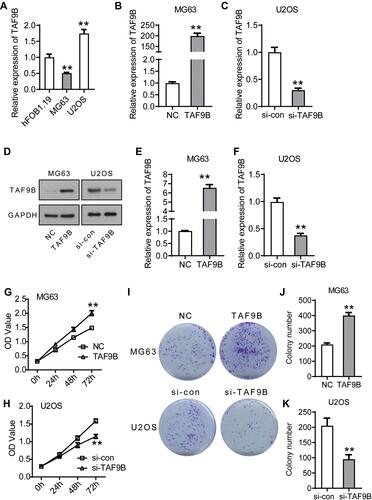
Figure 2 TAF9B promotes migration and invasion and inhibits apoptosis in OS cells. (A–C), After the transfection for 48 h, transwell assay was performed to detect the migration and invasion in each group cells. Microphotographs were taken at 100x magnification. (D–G), Cell apoptosis was determined using flow cytometry analysis. (H), The expression levels of the apoptosis protein was detected by Western blot. (I–J), The column diagram represented the levels of protein relative to the control group. **p<0.01.
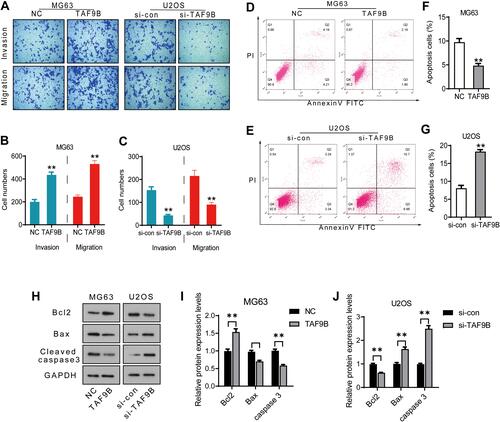
Figure 3 TAF9B activates the AKT/mTOR signaling pathway in OS cells. (A), The phosphorylation levels of AKT and mTOR were detected using Western blot. (B–C), The column diagram represented the levels of protein relative to the control group. (D), The expression levels of Cyclin D1, p70, Snail, and Twist were detected using Western blot. (E–F), The column diagram represented the levels of protein relative to the control group. **p<0.01; *** p<0.001.
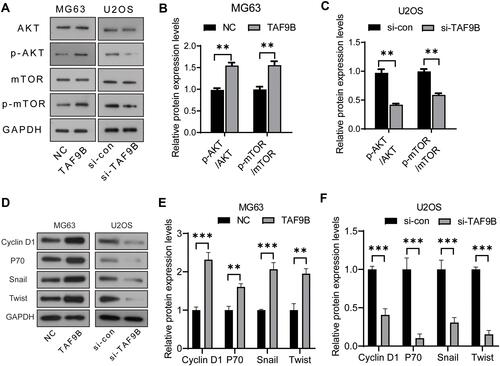
Figure 4 miR-7-5p inhibits the expression of TAF9B through targeting its 3ʹUTR region in OS cells. (A), Binding sites between TAF9B and miR-7-5p were analyzed on a starBase dataset. The wild and mutant-type sequences of TAF9B’s 3ʹUTR were used to construct plasmids for double luciferase assay. (B), The binding between TAF9B’s 3ʹUTR and miR-7-5p was analyzed using double luciferase assay. (C), miR-7-5p mimics were transfected into MG63 and U2OS cells (miR-7-5p group). TAF9B expression was detected using Western blot. (D), The column diagram represented the level of TAF9B relative to the control group. **p<0.01.
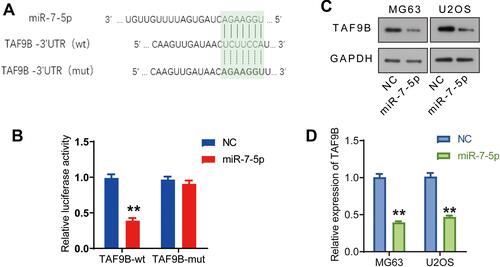
Figure 5 miR-7-5p inhibits the proliferation and metastasis in OS cells, which is blocked by TAF9B overexpression. MiR-7-5p mimics and inhibitor were transfected into MG-63 and U2OS cells to generate miR-7-5p overexpressed (miR-7-5p group) and knockdown cells (miR-7-5p inhibitor group), respectively. TAF9B overexpression plasmid and siRNA were transfected into the above cells for remediation assay. CCK-8 assay was performed to detect the proliferation in MG-63 (A) and U2OS (B) cells. (C–E), The invasive abilities of each cell group was detected using transwell assay. Microphotographs were taken at 100x magnification. ***p<0.001 vs NC or si-con group; ##p<0.01 vs miR-7-5p or miR-7-5p inhibitor group.
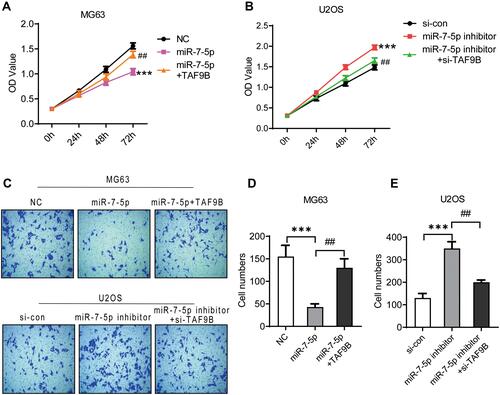
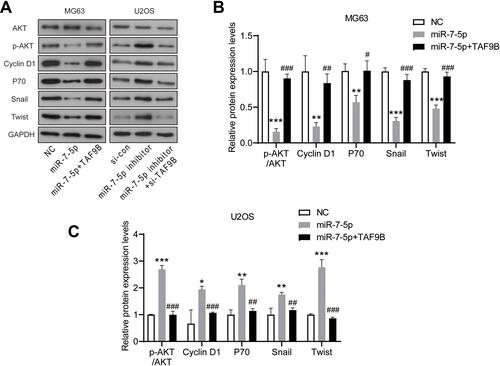
Figure 6 miR-7-5p inhibits the AKT pathway in OS cells, which is blocked by TAF9B overexpression. (A), The expression levels of AKT, p-AKT, Cyclin D1, p70, Snail, and Twist were detected using Western blot. (B and C), The column diagram represented the levels of protein relative to the control group. *p<0.05, **p<0.01 and ***p<0.001 vs NC or si-con group; #p<0.05, ##p<0.01 and ###p<0.001 vs miR-7-5p or miR-7-5p inhibitor group.