Figures & data
Table 1 Relationship Between LINC01278 and Clinical Data of OS Patients
Table 2 Cox Regression Analysis
Figure 1 Relationship between expression and survival of LINC01278 in OS. (A) RT-qPCR detected the relative expression level of LINC01278 in tissues of OS patients. (B) RT-qPCR detected the relative expression level of LINC01278 in serum of OS patients. (C) Pearson test analyzed the correlation between the relative expression of LINC01278 in OS patients’ tissues and serum. (D) Kaplan-Meier survival analyzed the conditions of 5-year survival of patients in the high LINC01278 expression group and the low LINC01278 expression group.
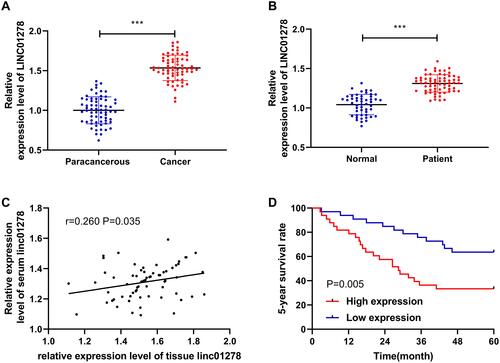
Table 3 ROC Parameters of LINC01278 in Diagnosing Clinical Indicators
Figure 2 ROC of LINC 01278 in diagnosis of OS and related clinical data. (A) ROC analysis of AUC of LINC01278 in diagnosis of OS and normal people. (B) ROC curve analysis of AUC of LINC01278 in diagnosis of tumor size of ≥3 cm and <3cm. (C) ROC curve analysis of AUC of LINC01278 in diagnosis of phase I–IIA and phase IIB–III. (D) ROC curve analysis of AUC of LINC01278 in diagnosis of distal metastasis.
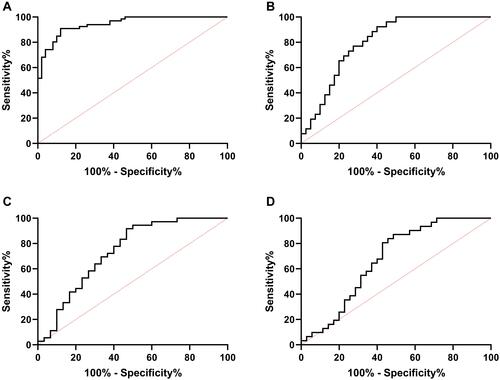
Figure 3 Effects of LINC01278 regulation on OS cell growth. (A) RT-qPCR detected the expression of LINC01278 in OS cell line. (B) RT-qPCR detected the relative expression of LINC01278 in cells after transfection of pcDNA-LINC01278 and sh-LINC01278. (C) CCK-8 detected cell proliferation after transfection of pcDNA-LINC01278 and sh-LINC01278. (D and E) Flow cytometry detected apoptosis and cycle changes of cells after transfection of pcDNA-LINC01278 and sh-LINC01278. (F) Flow cytometry to detect cell cycle changes after cells transfected with si-LINC01278.
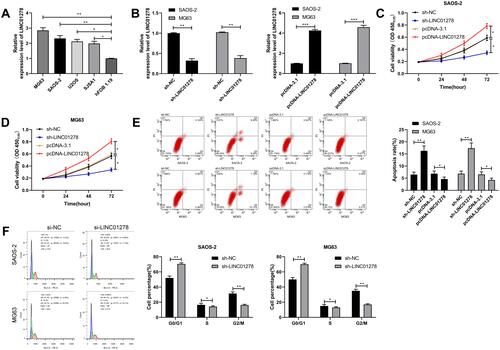
Figure 4 LINC01278 can act as a sponge for miR-134-5p. (A) starBase, miRBD, LncBase predicted and analyzed online that LINC01278 could combine with miR. (B) Binding sites and mutation sites between LINC01278 and miR-134-5p. (C) RT-qPCR detected miR-134-5p relative expression in cells transfected with sh-LINC01278 and pcDNA-LINC01278. (D) Dual luciferase reporter detected the effects of miR-134-5p-mimics and miR-134-5p-inhibit on the fluorescence activity of LINC01278-WT. (E) RIP confirmed the targeted binding of LINC01278 and miR-134-5p. (F) RNA pull-down confirmed the targeted binding of LINC01278 and miR-134-5p. (G) Relative expression of miR-134-5p in the tissues of OS patients was detected by RT-qPCR. (H) Pearson analysis revealed the correlation of LINC01278 and miR-134-5p in tissues of OS patients.
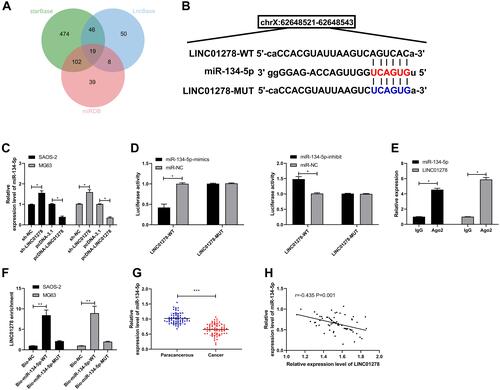
Figure 5 miR-134-5p can target KRAS. (A) starBase, miRBD, TargetScan, miRTarBase predicted online that miR-134-5p could bind to target genes. (B) Binding sites and mutation sites between LINC01278 and KRAS. (C) RT-qPCR and WB detected the relative expression of miR-134-5p in cells transfected with miR-134-5p-mimics and miR-134-5p-inhibit. (D) Dual luciferase reporter detected the effects of miR-134-5p-mimics and miR-134-5p-inhibit on the fluorescence activity of KRAS-WT. (E) RT-qPCR detected KRAS relative expression in OS patient tissues. (F) Pearson correlation analyzed the correlation between LINC01278, miR-134-5p and KRAS in OS patient tissues.
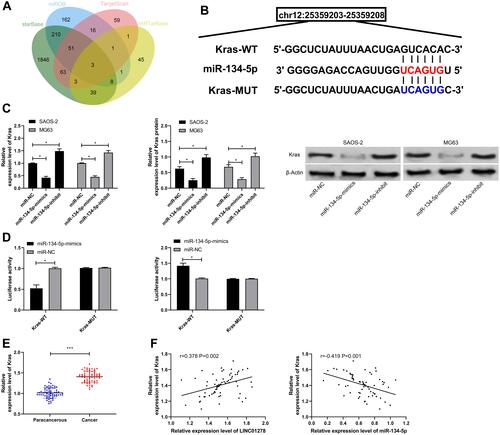
Figure 6 LINC01278 inhibits OS cell proliferation and apoptosis by regulating miR-134-5p/KRAS. (A) CCK-8 detected the change of cell proliferation ability after co-transfection. (B and C) Flow cytometry detected apoptosis and cell cycle changes after co-transfection.
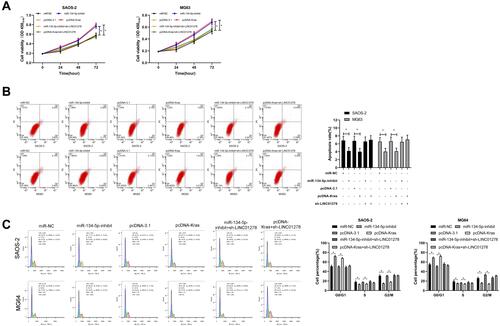
Figure 7 Effects of LINC01278 regulation on OS growth. (A) In vivo experiments confirmed the effects of LINC01278 regulation on OS tumor volume. (B) In vivo experiments confirmed the effects of LINC01278 regulation on OS tumor mass. (C) RT-qPCR detected the relative expression of miR-134-5p in nude mice tumor tissues. (D) RT-qPCR and WB detected the relative expression of KRAS mRNA and protein in tumor tissues of nude mice.
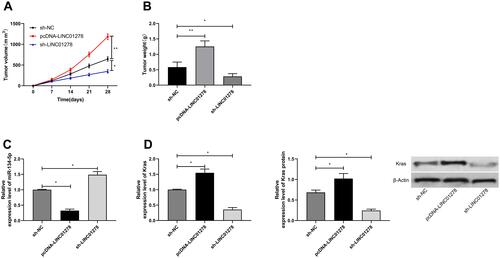
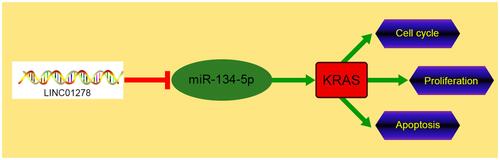
Figure 8 Schematic diagram of LINC01278/miR-134-5p/KRAS in OS.