Figures & data
Figure 1 P-Rex1 expression in liver cancer. (A) Immunohistochemical staining of P-Rex1 in tumor and paired adjacent non-tumor (normal) tissues from patients (original magnification: scale bars = 100 μm, inset: scale bars = 25 μm), n=5. (B and C) P-Rex1 and MPO mRNA expression was analyzed in malignant liver tissues and adjacent non-malignant tissues using the GEO datasets (GSE121248 and GSE112790). (D) The Kaplan-Meier overall survival (OS) curves were presented. Liver cancer patients with vascular invasion were divided into a high P-Rex1 expression group and a low P-Rex1 expression group. (E and F) The protein and mRNA levels of P-Rex1 in five liver cancer cell lines. (G) The stable scrambled control clone and P-Rex1 knockdown clones (shPR1, shPR2, and shPR3) were constructed using recombinant lentiviral transfection. Representative Western blots and bar charts are shown. Quantitative data are shown as means ± SEM from three independent experiments. (*P < 0.05, **P < 0.01, and ***P < 0.001).
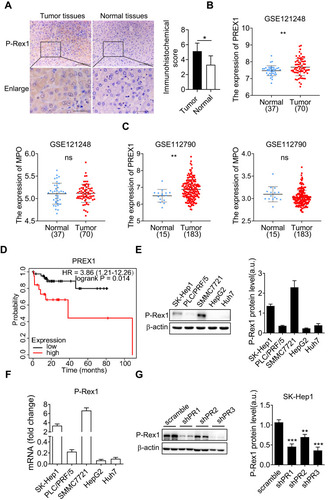
Figure 2 P-Rex1 regulates cell cycle transition in SK-Hep1 cells. (A) Cell phase distribution in scrambled control and P-Rex1 knockdown (shP-Rex1) cells. The ratio is presented as a bar diagram. (B) The expression of p21 protein after HGF treatment for the indicated time (h) in the control and shP-Rex1 groups of SK-Hep1 cells. Each experiment was repeated three times. The data are presented as means ± SEM. (*P < 0.05 and ***P < 0.001).
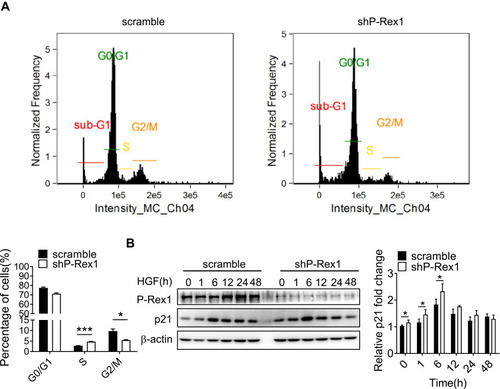
Figure 3 Downregulation of P-Rex1 attenuates proliferation and migration in SK-Hep1 cells. (A) A BrdU assay was performed to determine the proliferation of scrambled control and P-Rex1 knockdown (shP-Rex1) cells in culture medium treated with or without HGF (20 ng/mL) for 48 h. (B and C) Scrambled control or shP-Rex1 cells were diluted and seeded into six-well plates to determine their colony forming capabilities. (D and E) A transwell migration assay was performed to evaluate the migratory behavior of scrambled control or shP-Rex1 cells treated with HGF (20 ng/mL). Representative images of migrated cells are shown, scale bars = 200 μm. (F and G) Wound closure with scrambled control or shP-Rex1 cells treated with HGF (20 ng/mL) or buffer control for a total of 32 h. Microphotographs were taken at 0, 16, and 32 h. Scale bars = 500 μm. Each experiment was repeated three times. The data are presented as means ± SEM. *P < 0.05 and ***P < 0.001 comparing shP-Rex1 cells with scrambled control cells; ##P < 0.01 and ###P < 0.001 comparing HGF-treated samples with untreated samples in the same group.
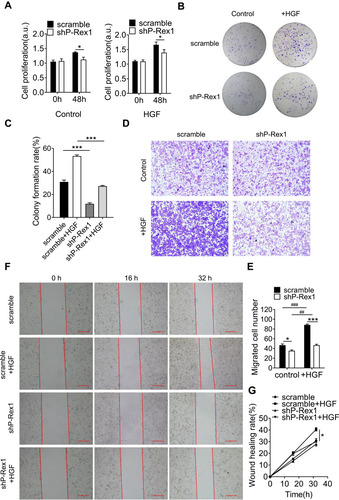
Figure 4 P-Rex1 downregulation inhibits xenograft tumor growth in vivo. (A) BALB/c-nu mice (male) were subcutaneously transplanted with SK-Hep1 cells transfected with scrambled-shRNA or P-Rex1-shRNA (n=6). The volumes of the tumors were measured and presented as the mean ± SEM. The tumors were removed for weight analysis at 29 days post-inoculation (B). (C) The expression of c-Met, p-Akt, and p-Erk1/2 in tumor tissue homogenates. The data are shown above as means ± SEM from three independent experiments. (*P < 0.05 and **P < 0.01).
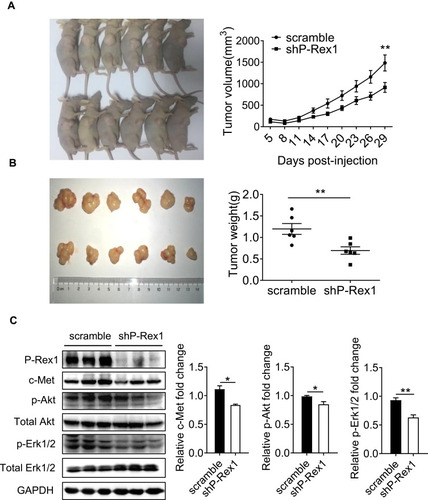
Figure 5 P-Rex1 is involved in HGF/c-Met signaling in SK-Hep1 cells. (A–D) Levels of phosphorylation of c-Met, Akt, and Erk1/2 after HGF stimulation for the indicated time (min) in scrambled control and P-Rex1 knockdown (shP-Rex1) cells. (E and F) ShP-Rex1 cells were transiently transfected with a P-Rex1-containing plasmid to restore its function. Western blotting for p-c-Met and c-Met was performed. Data quantification is shown below. (G–I) Control and P-Rex1 knockdown cells were stained with Rhodamine-conjugated phalloidin after HGF stimulation for 60 min, and signal was quantified. Different power images were included. Scale bars =10 μm. The data are shown above as means ± SEM from three independent experiments. (*P < 0.05, **P < 0.01, and ***P < 0.001).
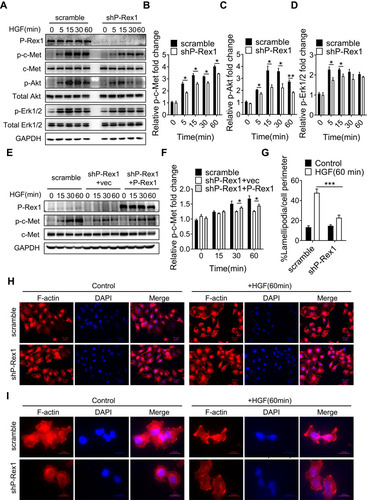
Figure 6 P-Rex1 expression promotes proliferation and migration in HepG2 cells. Stable vector control clone (VEC) and P-Rex1 overexpression clone (PROE) were constructed using recombinant lentiviral transfection. A representative Western blot (A) and RT-qPCR (B) are shown. (C) A BrdU assay was performed to determine the proliferation of VEC and PROE cells in culture medium treated with HGF (20 ng/mL) for 48 h. (D and E) A transwell assay was performed to evaluate the invasive behavior of VEC and PROE cells treated with HGF (20 ng/mL). Representative images of migrated cells are shown, scale bars = 250 μm. (F–I) Levels of phosphorylation of c-Met, Akt, and Erk1/2 after HGF stimulation in VEC and PROE cells. The data are shown as mean ± SEM from three independent experiments. (*P < 0.05, **P < 0.01, and ***P < 0.001).
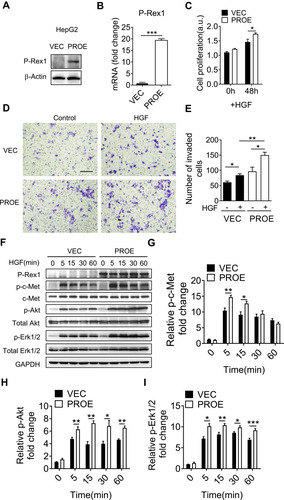
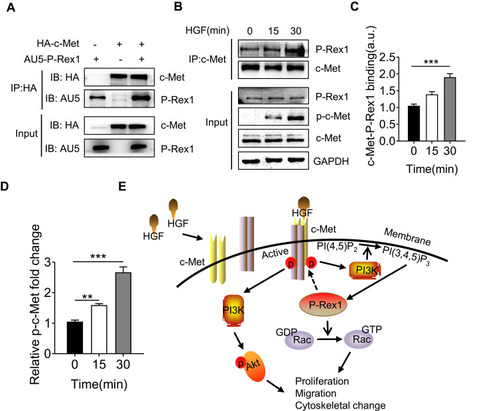
Figure 7 P-Rex1 and c-Met form a protein complex. (A) 293T cells were co-transfected with both HA-tagged human c-Met plasmid and AU5-tagged human P-Rex1 plasmid or were transfected separately. Cell lysates were subjected to immunoprecipitation with anti-HA antibody followed by Western blot analysis with an anti-AU5 antibody. (B and C) SK-Hep1 cells were treated with HGF (20 ng/mL) or buffer control for the indicated times. Co-immunoprecipitation was performed using anti-c-Met antibody. P-Rex1 expression was determined through Western blotting. (D) Levels of phosphorylation of c-Met. (E) Schematic drawing depicting P-Rex1’s involvement in the HGF/c-Met/Akt pathway. The data are shown above as means ± SEM from three independent experiments. (**P < 0.01 and ***P < 0.001).