Figures & data
Table 1 Characteristics of Study Participants
Table 2 Significant Metabolites Detected by ND-EESI-MS
Figure 1 Typical ND-EESI-MS spectra in positive mode of human sputum samples of a lung adenocarcinoma (LAC) patient and a control group.
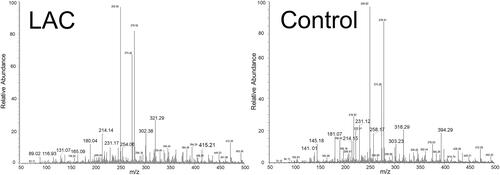
Figure 2 Heat map of significantly changed metabolites detected by ND-EESI-MS for comparison of LAC/Con.
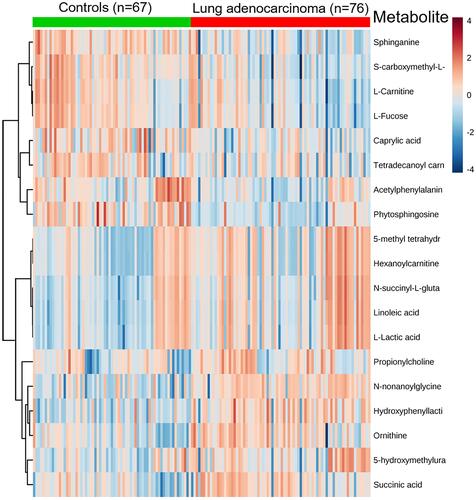
Figure 3 Differential characteristics of enhanced biomarker panel with 5 differential metabolites (AUC > 0.75 and VIP > 1) detected by ND-EESI-MS for distinguishing between lung adenocarcinoma patients (LAC, n = 76) and controls (Con, n = 67). (A) Log10- transformed relative abundance of 5 differential metabolites for comparison between LAC and Con. (B) QC normalized relative abundance data were log10-transformed and Pareto scaled. Score plot of the OPLS-DA model for discrimination between LAC and Con. [R2X (cum)= 0.301, R2Y (cum)= 0.228, Q2 (cum)= 0.494]. (C) QC normalized relative abundance data were log10-transformed and Pareto scaled. ROC curve illustrating the classification performance of the 5-metabolite OPLS-DA model for distinguishing between LAC and Con. [AUROC = 0.917, 95% CI: 0.861–0.965, sensitivity: 0.9, specificity: 0.8]. (D) QC normalized relative abundance data were log10-transformed and Pareto scaled. External validation of OPLS-DA model with 50% sample holdout: cross-validation classification accuracy of 87.9% using a PLS-DA classifier.
![Figure 3 Differential characteristics of enhanced biomarker panel with 5 differential metabolites (AUC > 0.75 and VIP > 1) detected by ND-EESI-MS for distinguishing between lung adenocarcinoma patients (LAC, n = 76) and controls (Con, n = 67). (A) Log10- transformed relative abundance of 5 differential metabolites for comparison between LAC and Con. (B) QC normalized relative abundance data were log10-transformed and Pareto scaled. Score plot of the OPLS-DA model for discrimination between LAC and Con. [R2X (cum)= 0.301, R2Y (cum)= 0.228, Q2 (cum)= 0.494]. (C) QC normalized relative abundance data were log10-transformed and Pareto scaled. ROC curve illustrating the classification performance of the 5-metabolite OPLS-DA model for distinguishing between LAC and Con. [AUROC = 0.917, 95% CI: 0.861–0.965, sensitivity: 0.9, specificity: 0.8]. (D) QC normalized relative abundance data were log10-transformed and Pareto scaled. External validation of OPLS-DA model with 50% sample holdout: cross-validation classification accuracy of 87.9% using a PLS-DA classifier.](/cms/asset/d8a1dfef-c10e-40bd-8802-c3c0b7543de8/dott_a_269300_f0003_c.jpg)
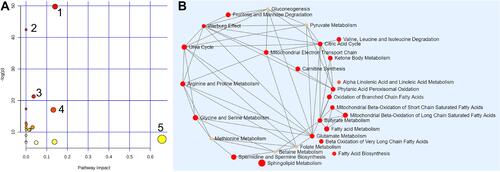
Figure 4 The metabolome view of pathway enrichment analysis comparing LAC patients and controls. (A) Overview of the most important metabolomic changes observed by ND-EESI-MS in sputum of lung adenocarcinoma patients, 1: Sphingolipid metabolism, 2: Tyrosine metabolism, 3: Ubiquinone and other terpenoid-quinone biosynthesis, 4: Arginine and proline metabolism, 5: Linoleic acid metabolism. (B) Metabolic network showing significant differences in sphingolipid metabolism, fatty acid metabolism, carnitine synthesis and Warburg effect, etc.