Figures & data
Table 1 RT-qPCR Primers
Figure 1 EZH2 was high-expressed in liver cancer and associated with poor survival and CD133+ HuH7 cells had a strong sphere-forming ability. (A) The expression of EZH2 in liver cancer tissues retrieved from the TCGA database was analyzed using GEPIA (http://gepia.cancer-pku.cn/index.html) (*P< 0.001, vs T). (B) The overall survival of liver cancer patients retrieved from the TCGA database was analyzed. (C) The expressions of EZH2 in normal liver epithelial cells and liver cancer cells were detected by RT-qPCR; GAPDH was used as an internal control (***P< 0.001, vs THLE3).(D–E) The expressions of EZH2 in normal liver epithelial cells and liver cancer cells were detected by Western blot; β-actin was used as an internal control (***P< 0.05, vs THLE3). (F) CD133+HuH7 cells in HuH7 cells were sorted out by flow cytometry. (G) The sphere-forming abilities of HuH7 and CD133+HuH7 cells were detected by tumor sphere formation assay (200× Magnification).
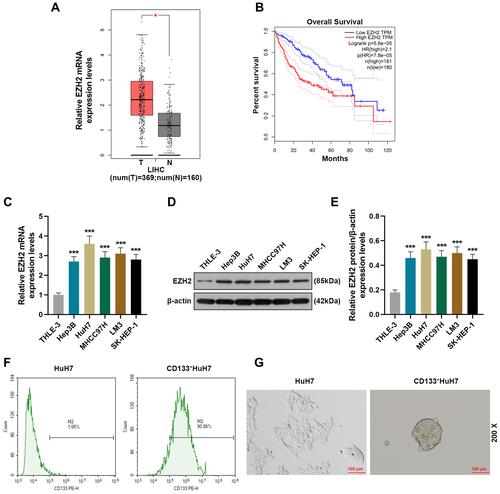
Figure 2 CD133+ HuH7 cells with high expression of EZH2 had high viability and a strong tumor-forming ability. (A) The expressions of EZH2 in CD133+HuH7 and CD133−HuH7 cells were detected by RT-qPCR; GAPDH was used as an internal control. (B–C) The expressions of EZH2 in CD133+HuH7 and CD133−HuH7 cells were detected by Western blot; β-actin was used as an internal control. (D) The viabilities of CD133+HuH7 and CD133−HuH7 cells were detected by MTT assay. (E) The xenograft tumor nude mice model was established by subcutaneous injection of CD133+HuH7 and CD133−HuH7 cells.(F) The tumor volume of the xenograft tumor nude mice was calculated every 7 days. (^^P< 0.01, ^^^P< 0.001, vs CD133+HuH7, **P< 0.01, ***P< 0.001, vs CD133+HuH7 103, ##P< 0.01, ###P< 0.001, vs CD133+HuH7 104).
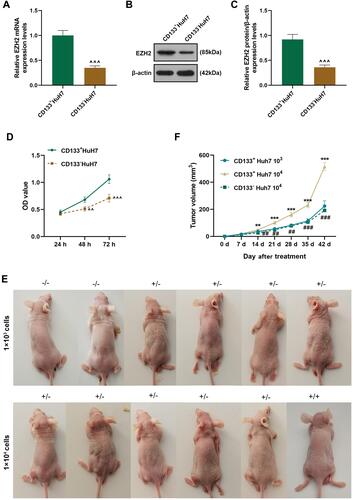
Figure 3 The inhibitory effect of UTMD-shEZH2 on the viability, proliferation, and tumorsphere formation of CD133+ HuH7 cells was stronger than that of LIP-shEZH2. (A) The transfection efficiencies of UTMD-shEZH2 and LIP-shEZH2 were evaluated by RT-qPCR; GAPDH was used as an internal control. (B–C) The transfection efficiencies of UTMD-shEZH2 and LIP-shEZH2 were evaluated by Western blot; β-actin was used as an internal control. (D) The viability of CD133+ HuH7 cells was detected by MTT assay. (E–F) The proliferation of CD133+ HuH7 cells was detected by colony formation assay. (G–I) The tumorsphere formation ability of CD133+ HuH7 cells was detected by tumorsphere formation assay (200× Magnification). (*P< 0.05, **P< 0.01, ***P< 0.001, vs LIP-shNC; ^^P< 0.01, ^^^P< 0.001, vs UTMD-shNC; #P< 0.05, ###P< 0.001, vs LIP-shEZH2).
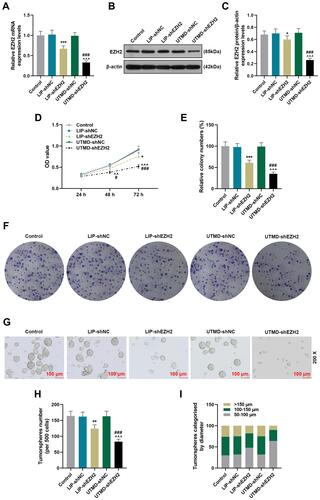
Figure 4 The inhibitory effect of UTMD-shEZH2 on the migration and invasion of CD133+ HuH7 cells was stronger than that of LIP-shEZH2. (A–B) The migration of CD133+ HuH7 cells was detected by wound healing assay (100× Magnification). (C–D) The invasion of CD133+ HuH7 cells was detected by transwell assay (250× Magnification). (**P< 0.01, ***P< 0.001, vs LIP-shNC; ^^^P< 0.001, vs UTMD-shNC; ###P< 0.001, vs LIP-shEZH2).
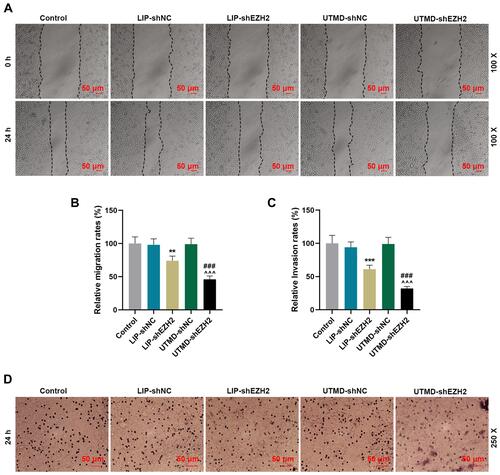
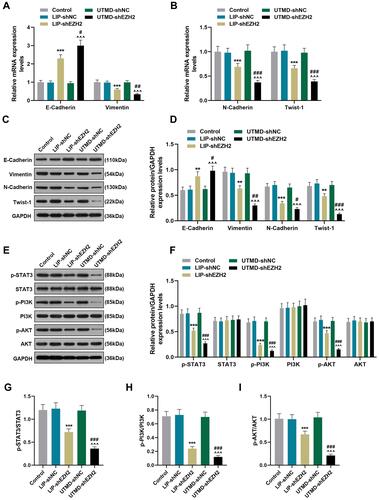
Figure 5 The regulatory effect of UTMD-shEZH2 on the expressions of EMT-related factors expressions and the activation of the STAT3/PI3K/AKT pathway in CD133+ HuH7 cells was stronger than that of LIP-shEZH2. (A–B) The expressions of E-Cadherin, Vimentin, N-Cadherin, and Twist-1 in CD133+ HuH7 cells were detected by RT-qPCR; GAPDH was used as an internal control. (C–D) The expression of E-Cadherin, Vimentin, N-Cadherin, and Twist-1 in CD133+ HuH7 cells were detected by Western blot; GAPDH was used as an internal control. (E–I) The expression of p-STAT3, STAT3, p-PI3K, PI3K, p-AKT, and AKT in CD133+ HuH7 cells were detected by Western blot; GAPDH was used as an internal control. (*P< 0.05, **P< 0.01, ***P< 0.001, vs LIP-shNC; ^^^P< 0.001, vs UTMD-shNC; #P< 0.05, ##P< 0.01, ###P< 0.001, vs LIP-shEZH2).
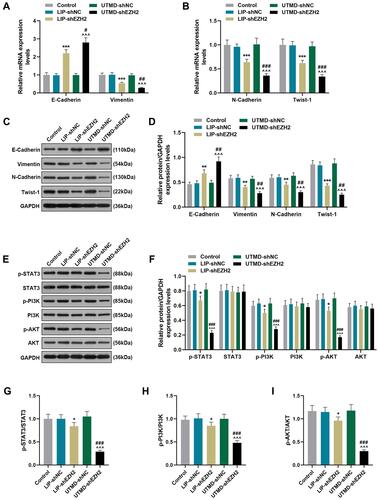
Figure 6 The regulatory effect of UTMD-shEZH2 on the expressions of EZH2, E-Cadherin, and Vimentin and the tumorigenicity of CD133+ HuH7 cells in vivo was stronger than that of LIP-shEZH2. (A) The expression of EZH2 in the tumor tissues of nude mice was detected by RT-qPCR; GAPDH was used as an internal control. (B–C) The expression of EZH2 in the tumor tissues of nude mice was detected by Western blot; GAPDH was used as an internal control. (D) The tumor morphology of nude mice was photographed with a camera. (E) The tumor weights of the nude mice were measured and recorded with an electronic balance. (F) The tumor volume of the nude mice was measured and recorded using a vernier caliper. (G–H) The expressions of E-Cadherin and Vimentin in the tumor tissues of nude mice were detected by immunohistochemical (200× and 400× Magnification). (**P< 0.01, ***P< 0.001, vs LIP-shNC; ^^^P< 0.001, vs UTMD-shNC; #P< 0.05, ##P< 0.01, ###P< 0.001, vs LIP-shEZH2).
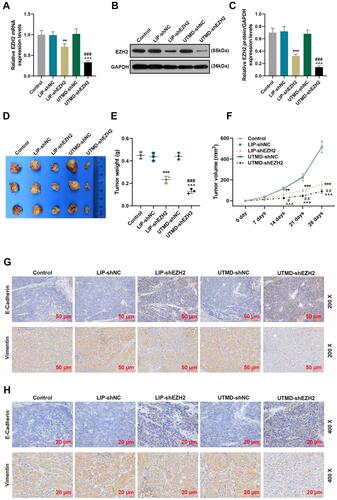
Figure 7 The regulatory effect of UTMD-shEZH2 on the expressions of EMT-related factors and the activation of the STAT3/PI3K/AKT pathway of CD133+ HuH7 cells in vivo was stronger than that of LIP-shEZH2. (A–B) The expressions of E-Cadherin, Vimentin, N-Cadherin, and Twist-1 in tumor tissues were detected by RT-qPCR; GAPDH was used as an internal control. (C–D) The expressions of E-Cadherin, Vimentin, N-Cadherin, and Twist-1 in tumor tissues were detected by Western blot; GAPDH was used as an internal control. (E–I) The expressions of p-STAT3, STAT3, p-PI3K, PI3K, p-AKT, and AKT in tumor tissues were detected by Western blot; GAPDH was used as an internal control. (**P< 0.01, ***P< 0.001, vs LIP-shNC; ^^^P< 0.001, vs UTMD-shNC; #P< 0.05, ##P< 0.01, ###P< 0.001, vs LIP-shEZH2).