Figures & data
Figure 1 PD‑L1 and Glut-1 expression, and CD4+, CD8+ T cells infiltration (the black arrows point) in HNSCC at baseline (pre-RT) and after RT (magnification ×400). Positive expression of PD-L1 pre-RT (A) and after RT (B); Positive expression of Glut-1 pre-RT (C) and after RT (D); CD4+ T cells infiltration in tumor tissues pre-RT (E) and after RT (F); CD8+ T cells infiltration in tumor tissues pre-RT (G) and after RT (H).
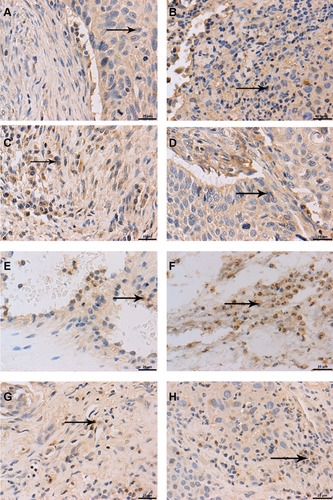
Table 1 Patient Characteristics
Figure 2 Survival analysis of patients with HNSCC. (A) Survival analysis of patients with high and low levels of PD-L1 expression. (B) Survival analysis of patients with high and low CD4+ T cell infiltration. (C) Survival analysis of patients with high and low CD8+ T cell infiltration.
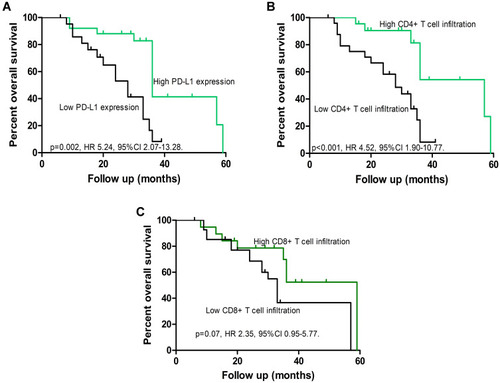
Table 2 Multivariate Analysis of Overall Survival in Patients with Hypopharyngeal Cancer
Figure 3 Alteration of PD-L1, and CD4+, CD8+ T cells after RT compared with pre-RT. (A) PD-L1 expression in tumor cells was significantly increased after RT compared with pre-RT. (B) CD4+ T cell infiltration was markedly increased after RT. (C) CD8+ T cell infiltration was markedly increased after RT. (D) Expression of PD-L1 was correlated with the expression of GLUT1 in pre-RT specimens. (E) PD-L1 expression tended to correlate with the expression of GLUT1 after RT (**p<0.01).
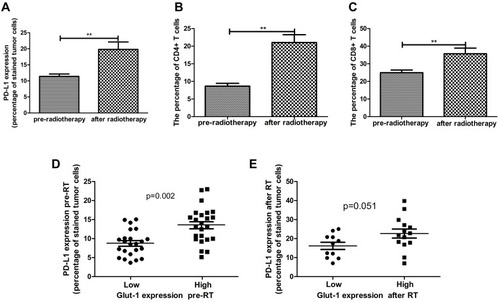
Figure 4 PD-L1 and GLUT1 expression before and after radiotherapy. (A) PD-L1 mRNA expression in FaDu cells was significantly upregulated at 96 h after RT compared with the control group (p<0.001). (B) PD-L1 protein expression was also significantly upregulated at 96 h after RT (p<0.001). (C) GLUT1 mRNA expression was decreased at 48 h after RT compared with the control group (p<0.01), and it was significantly increased at 96 h after RT compared with 48 h after RT (p<0.001). (D) GLUT1 protein expression was decreased at 48 h after RT compared with the control group and the 24-h after RT group (p<0.01 and p<0.05, respectively). GLUT1 protein expression was significantly increased at 96 h after RT compared with 48 h after RT (p<0.001). (*p<0.05, **p<0.01, ***p<0.001).
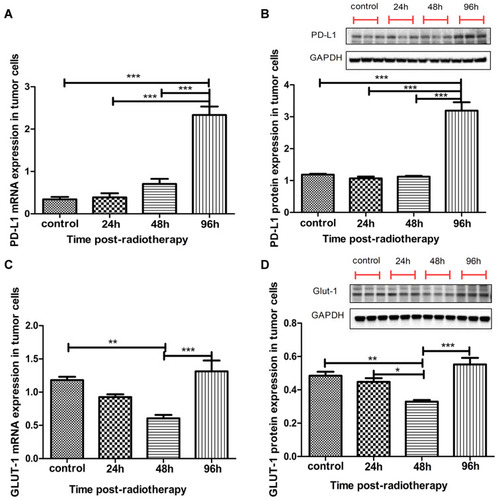
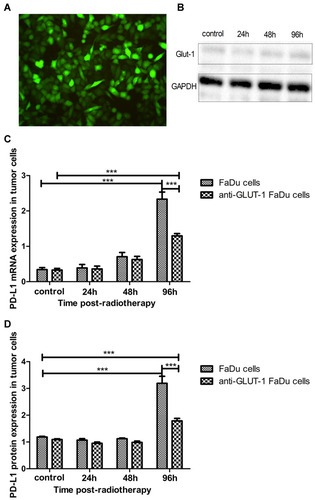
Figure 5 PD-L1 expression before and after RT in siRNA-GLUT1 FaDu cells. (A) Transfection efficiency of GLUT1 siRNA by fluorescence analysis. (B) GLUT1 protein expression in siRNA-GLUT1 FaDu cells before and after RT. (C, D) PD-L1 mRNA and protein expression in siRNA-GLUT1 FaDu cells was significantly decreased at 96 h after RT compared with that recorded in FaDu cells, as presented by the two-way analysis of variance (p<0.001 and p<0.001, respectively). (***p<0.001).