Figures & data
Figure 1 Flow chart of this article.
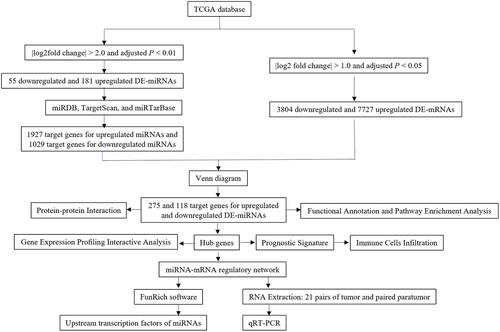
Figure 2 Screening of candidate DEGs. (A) The intersection of target genes of upregulated DE-miRNAs and downregulated target genes of DE-mRNAs; (B) the intersection of target genes of downregulated DE-miRNAs and upregulated target genes of DE-mRNAs. Blue represents target genes of DE-miRNAs. Yellow represents DE-mRNAs.
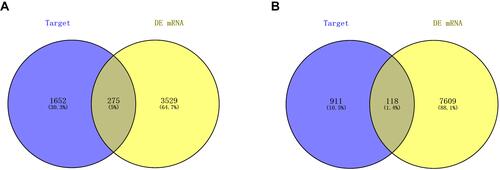
Figure 3 The enriched functions for DEGs of DE-mRNAs and DE-miRNAs. (A) The top 10 enriched BP items of downregulated candidate genes; (B) the top 10 enriched BP items of upregulated candidate genes; (C) the top 10 enriched CC items of downregulated candidate genes; (D) the top 10 enriched CC items of upregulated candidate genes; (E) the top 10 enriched MF items of downregulated candidate genes; (F) the top 10 enriched MF items of upregulated candidate genes (GO: gene ontology); (G) the top 10 enriched KEGG items of downregulated candidate genes; (H) the top 10 enriched KEGG items of downregulated candidate genes.
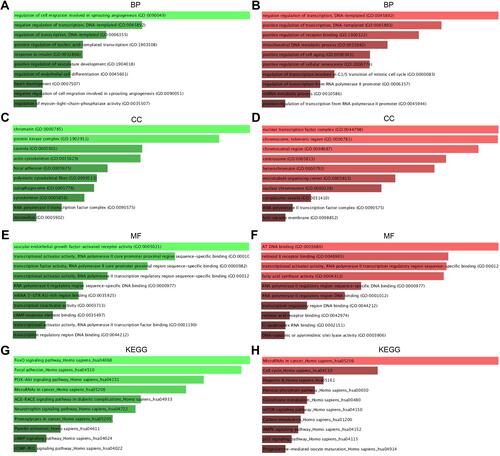
Figure 4 PPI network of the candidate target genes. (A) Upregulated DE-miRNAs; (B) downregulated DE-miRNAs.
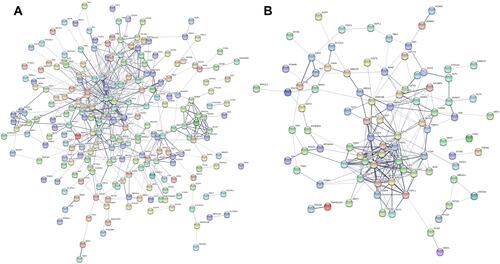
Figure 5 The expression levels of 17 hub genes from the GEPIA database. (A) CTGF expression; (B) FOXO1 expression; (C) IRS1 expression; (D) JUN expression; (E) KDR expression; (F) NR3C1 expression; (G) TNS1 expression; (H) BIRC5 expression; (I) CCNA2 expression; (J) CCNE1 expression; (K) CDC25A expression; (L) CEP55 expression; (M) CHEK1 expression; (N) ESPL1 expression; (O) EZH2 expression; (P) KIF23 expression; (Q) RRM2 expression. *p < 0.05.
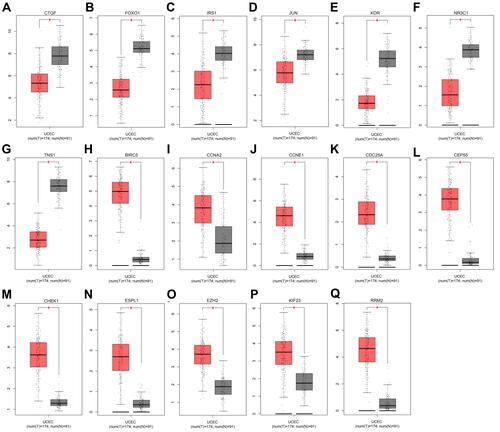
Figure 6 Regulatory network of miRNA-mRNAs and corresponding transcription factors. (A) Regulatory network of RC‐associated genes and their target miRNAs (red: upregulation, blue: downregulation, oval: mRNA, rectangle: miRNA); (B) predicted transcription factors of upregulated DE-miRNAs; (C) transcription factors of downregulated DE-miRNAs.
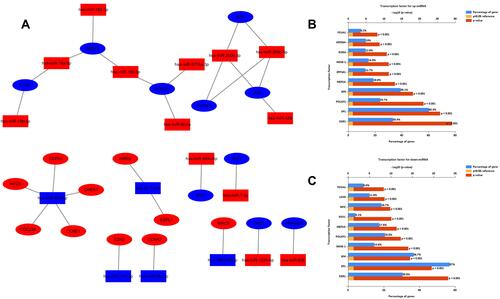
Figure 7 Expression of potential miRNAs and target genes in EC tissues and normal adjacent tissues. (A–F) miRNA expression levels; (G–L) mRNA expression levels. *p<0.05; **p<0.01.
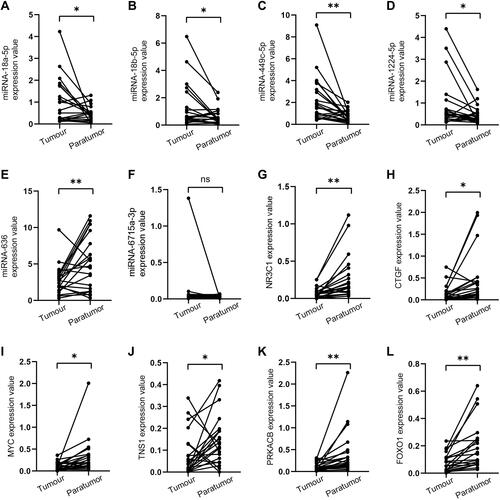
Figure 8 Analysis of the prognostic model between low- and high-risk groups. (A) Kaplan-Meier survival curve of overall survival between the high-risk group and low-risk group; (B) the time-dependent survival ROC curves; (C) the distributions of risk score; (D) survival status; (E) the heatmap showing the expression levels of the three genes in low- and high-risk groups.
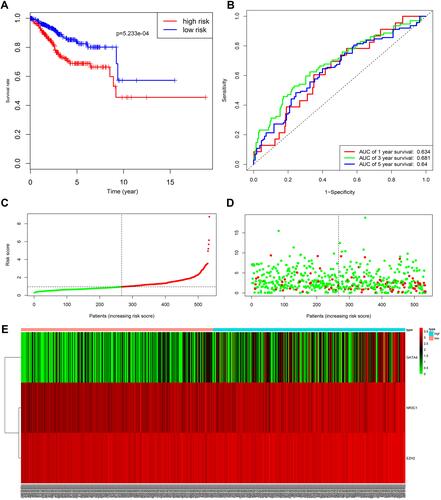
Figure 9 Study of the factors impacting EC prognosis. (A) The heatmap comparing the distribution of clinicopathological features in the low- and high-risk groups. **p<0.01; ***p<0.001; (B) Forest Plot for univariate Cox regression analysis of clinical factors and risk score; (C) Forest Plot for multivariate Cox regression analysis of clinical factors and risk score; (D) Kaplan-Meier survival curve of age ≥60 years old subgroup between the low- and high-risk groups for the overall survival rate in EC; (E) Kaplan-Meier survival curve of stage III/IV subgroup between the low- and high-risk groups for the overall survival rate in EC.
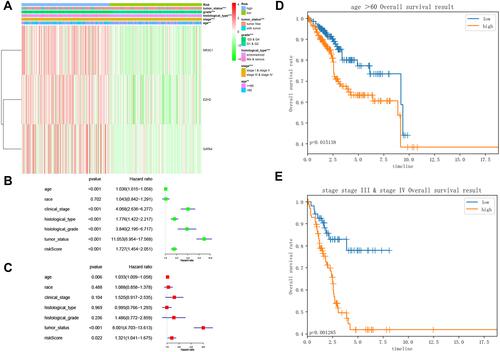
Figure 10 Nomogram predicting overall survival for EC patients. (A) For each patient, seven lines are drawn upward to determine the points received from the seven predictors in the nomogram. The sum of these points is located on the ‘Points’ axis. Then a line is drawn downward to determine the possibility of 1‑, 3‑, and 5‑year overall survival of EC. (B–D) The calibration plot for internal validation of the 1‑, 3‑, and 5‑year overall survival nomogram. Y‑axis: actual survival; X‑axis: nomogram‑predicted survival.
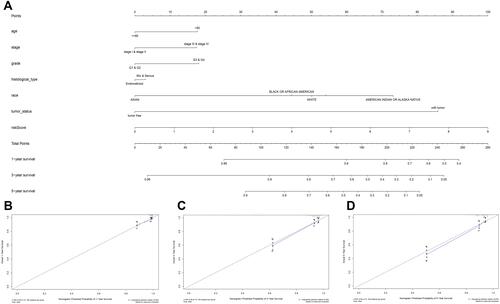
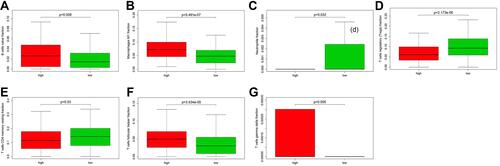
Figure 11 Relationship of risk score with the significant immune cell. (A) B cells naive fraction; (B) macrophages M1; (C) neutrophils; (D) T cells regulatory (Tregs); (E) T cells CD4 memory resting; (F) T cells follicular helper; (G) T cells gamma delta.