Figures & data
Table 1 The Primers Used in qRT-PCR
Table 2 The 13 Predicted Common miRNAs
Figure 1 Detection of the miR-1249 expression in gastric cancer specimens gained from TCGA database and cell lines. (A) There are 13 potential targets of common miRNAs were acquired from the intersection miRNAs that had meaningful survival (3273) and differential expression miRNAs (294) in gastric cancer on the basis of TCGA database. (B) The expression of miR-1249 in 367 gastric cancer tissues and 13 normal samples according to TCGA database. (C) Compared with low miR-1249 expression, Kaplan–Meier survival curves displayed that the overall survival was worse in gastric cancer patients with high miR-1249 expression. (D) The miR-1249 expression level was higher in all gastric cancer cell lines (AGS, MGC-803 and SNU1) compared to that of normal cell line GES-1. **p<0.01 vs GES-1 group. (E) The expression level of miR-1249 in gastric cancer cells treated with miR-1249 mimic/inhibitor. **p<0.01 vs mimic NC group. ##p<0.01 vs inhibitor NC group.
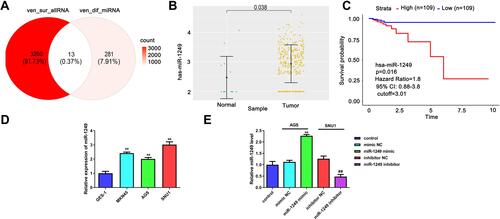
Figure 2 The influences of miR-1249 on gastric cancer cell proliferation, migration invasion and apoptosis. (A) Cell proliferation was detected by CCK8 assay in AGS and SNU1 cells. (B) The number of colonies in the expression of miR-1249 formed by AGS and SNU1 cells were tested by colony-forming assay. (C) The cell invasion and migration of AGS and SNU1 cells were tested by transwell assay. (D) The apoptosis of AGS and SNU1 cells were tested by flow cytometry assay. (E) The protein levels of p53, Bcl-2, Bax, Cleaved Caspase-9. **p<0.01 vs mimic NC group, ##p<0.01 vs inhibitor NC group.
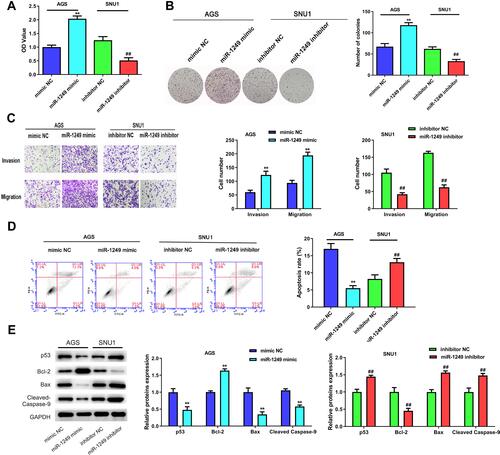
Figure 3 GNA11 is negatively modulated by miR-1249 and is lowly expressed in gastric cancer tissues and cell lines. (A) There were three common genes were gained from the intersection of veen diagram. (B) In gastric cancer samples, GNA11 expression was negatively related to miR-1249 expression, which was analyzed by Pearson correlation coefficient. (C) The 3ʹUTR of GNA11 containing the wide type (WT) or mutant type (MUT) binding sites between GNA11 and miR-1249. (D) The relative luciferase activity of GNA11-WT was decreased in miR-1249 mimic group compared to mimic NC group. **p < 0.01 vs mimic NC group. (E) The mRNA and protein levels of GNA11 in miR-1249-overexpressing or miR-1249-depletion in gastric cancer cells. **p < 0.01 vs mimic NC group. ##p < 0.01 vs inhibitor NC group. (F) GNA11 was lowly expressed in gastric cancer tissues relative to normal samples. (G) Kaplan–Meier analyzed the association of high and low GNA11 expression with the overall survival in gastric cancer patients. (H) GNA11 was down-regulated in all gastric cancer cell lines (AGS, MGC-803 and SNU1) relative to that in normal cell line GES-1. **p<0.01 vs GES-1 group.
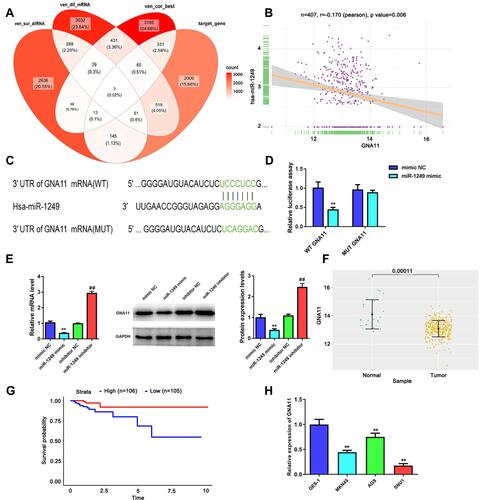
Figure 4 GNA11 reverses the properties of miR-1249 in gastric cancer cells. (A) Cell proliferation was detected by CCK8 assay in AGS and SNU1 cells. (B) The number of colonies in the expression of miR-1249 formed by AGS and SNU1 cells were tested by colony-forming assay. (C) The cell invasion and migration of AGS and SNU1 cells were tested by transwell assay. (D) The apoptosis of AGS and SNU1 cells were tested by flow cytometry assay. **p<0.01 vs mimic NC group. ##p<0.01 vs miR-1249 mimic group. &&p<0.01 vs miR-1249 mimic+pcDNA3.1 group.
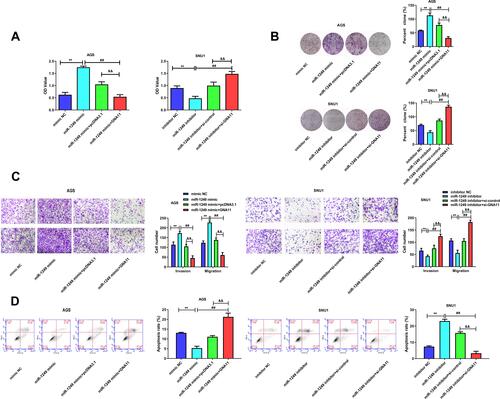
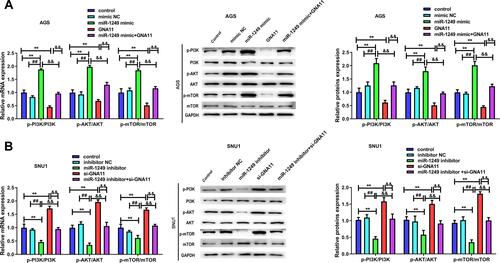
Figure 5 The influences of miR-1249/GNA11 on gastric cancer cell properties may be regulated by PI3K/AKT/mTOR pathway. Through qRT-PCR and Western blotting, the mRNA and protein levels of p-PI3K, p-AKT, p-mTOR in (A) AGS and (B) SNU1 cells were determined. **p<0.01 vs control group. ##p<0.01 vs mimic NC group. &&p<0.01 vs miR-1249 mimic+GNA11 group.