
Figures & data
Table 1 Summary of Patient and Tumor Characteristics
Table 2 Comparison of Treatment Effect in Groups A and B (Wilcoxon Test)
Figure 1 CT scan images of typical patients in group A.(A1, A2) CT scan of a 82-year-old male patient with Squamous cell carcinoma. (A1) The pre-treatment CT image shows a mass in the right upper lobe (September 19, 2016). (A2) The target lesion significantly decreased in size after the combination of iodine-125 seed implantation and single-agent chemotherapy regimen. The chest pain symptoms were relieved considerably (March 15, 2017). (B1–B4). CT scan of a 64-year-old female patient with adenocarcinoma. (B1) The pre-treatment CT image shows a lesion in middle lobe of right lung (March 10, 2016). (B2) Five months after treatment, the CT scan indicated a complete response (October 23, 2016). (B3, B4) After continuous follow-up, the lesion disappeared and remained in a slight high-density area in the middle lobe of the right lung (April 29, 2020).
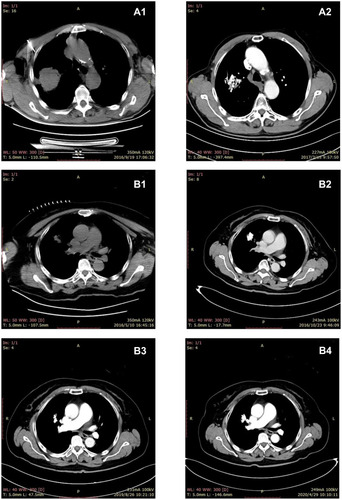
Figure 2 Kaplan–Meier curve of progression-free survival of patients in both groups A and B.
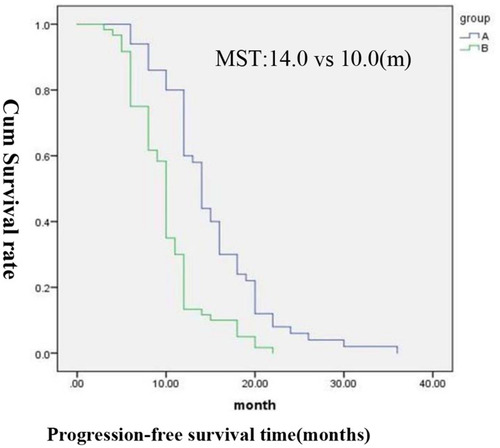
Figure 3 Kaplan–Meier curve of overall survival of patients in both groups A and B.
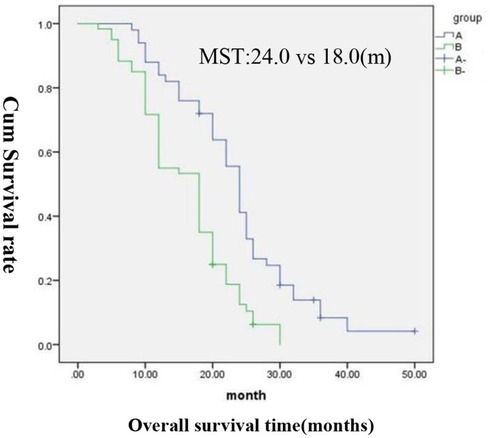
Table 3 Relief of Clinical Symptoms and Laboratory Indicators Associated with NSCLC in Both Groups (Wilcoxon Test)
Table 4 Adverse Reactions of Chemotherapy Observed in Both Groups Upon Follow-Up (X2 Test)