Figures & data
Figure 1 Volcano plots and hierarchical clustering of differentially expressed proteins (DEPs) among poorly- (G3), moderate- (G2) and well-differentiated (G1) hepatocellular carcinoma (HCC). Volcano plots showing the distribution of significance fold change of DEPs between (A) G1 and G2, (B) G1 and G3, and (C) G2 and G3 HCC. The red spots and green spots indicate significantly up-regulated and down-regulated proteins, respectively. (D) Hierarchical clustering representing of 21 DEPs. Red indicates upregulation and green represents downregulation (color bar next to the figure).
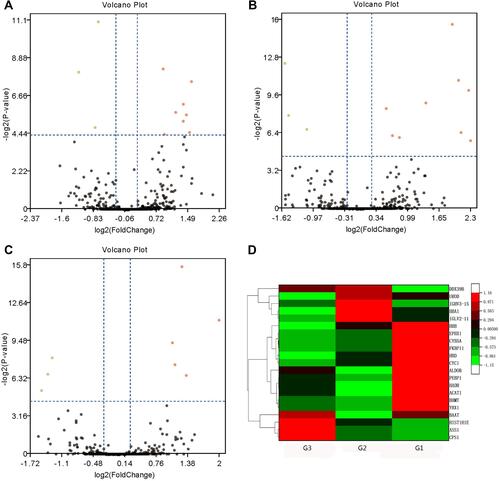
Table 1 List of Differentially Expressed Proteins as Potential Biomarker Candidates for Well- and Poorly-Differentiated Hepatocellular Carcinoma
Table 2 Statistical Information on the Differentially Expressed Proteins
Figure 2 Abundance ratio of differentially expressed proteins ASS1, CPS1, UROD, HBB, CYB5A, YBX1, and FKBP11 between hepatocellular carcinoma (HCC) tumor and non-tumorous tissues, and among well- (G1), moderate- (G2), and poorly- (G3) differentiated HCC. ASS1 and CPSI were up-regulated, while UROD and HBB were down-regulated in G3 compared with G1 and G2 tissues; CYB5A, YBX1, and FKBP11 were up-regulated in G1 compared with G2 and G3 tissues.
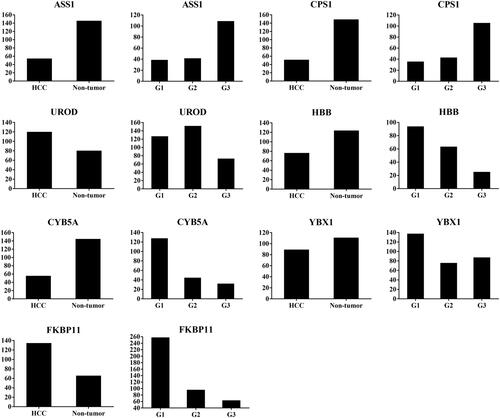
Figure 3 Representative immunohistochemical staining for seven candidate proteins (ASS1, CPS1, UROD, HBB, CYB5A, YBX1, and FKBP11) between hepatocellular carcinoma (HCC) and adjacent non-tumorous tissues. The scale bar is 500 μm.
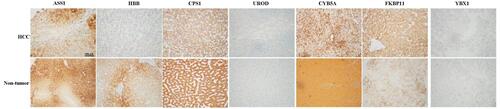
Figure 4 Representative immunohistochemical staining for seven candidate proteins (ASS1, CPS1, UROD, HBB, CYB5A, YBX1, and FKBP11) among well- (G1), moderate- (G2), and poorly (G3) differentiated hepatocellular carcinoma (HCC) tissues. The original scale bar is 500 μm.
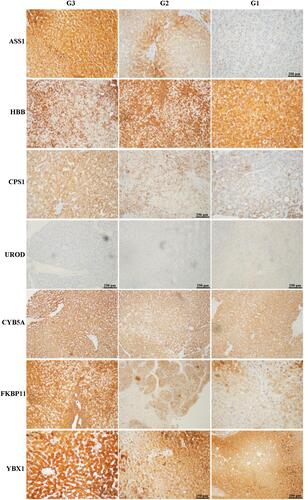
Figure 5 Gene Ontology enrichment analysis of the 7 DEPs (ASS1, CPS1, UROD, HBB, CYB5A, YBX1, and FKBP11) potentially for identifying poorly- and well-differentiated hepatocellular carcinoma.
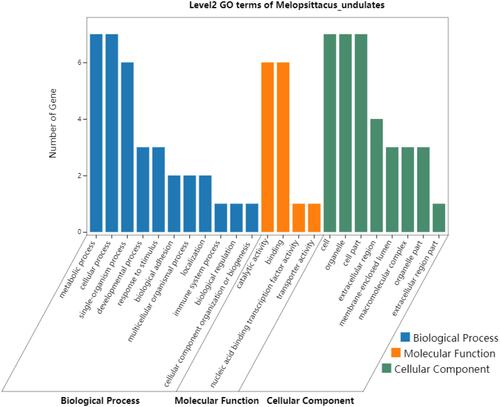
Table 3 KEGG Pathway Enrichment Analysis of Differentially Expressed Proteins Between Well- and Poorly-Differentiated Hepatocellular Carcinoma
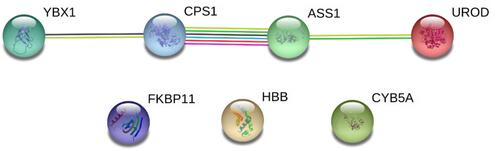
Table 4 Protein–Protein Interaction Analysis of the Differentially Expressed Proteins Between Well- and Poorly-Differentiated Hepatocellular Carcinoma
Figure 6 STRING networks of the 7 DEPs (ASS1, CPS1, UROD, HBB, CYB5A, YBX1, and FKBP11) potentially for identifying poorly- and well-differentiated hepatocellular carcinoma. Different line colours represent the types of evidence for the association. Green colour depicts neighbourhood; Red colour: Gene fusion; Pink colour: Experiments; Light green colour: Text mining; Blue colour: Cooccurrence; Dark blue colour: Coexpression; Purple colour: Homology; and circle nodes indicated different proteins. Interaction networks are shown in evidence view.