Figures & data
Table 1 Primer Sequences of the Genes for Real-Time PCR
Figure 1 Detection of the expression of miR-29b-3p and MAZ and identification of target genes. (A) The mRNA expression of miR-29b-3p in cancer cell lines and AGS cells. (B) The mRNA expression of MAZ in cancer cell lines and AGS cells. (C) The mRNA expression of MAZ in cells transfected with the miR-29b-3p mimics. (D) The protein expression of MAZ in cells transfected with the miR-29b-3p mimics. (E) Dual luciferase reporter verification of the target gene. *P < 0.05, **P < 0.01.
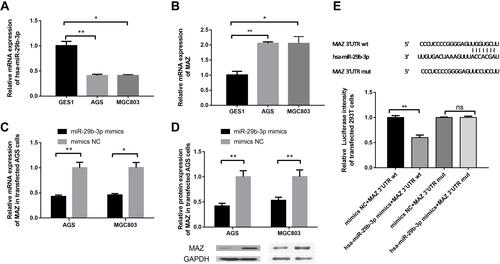
Figure 2 Effects of overexpression of miR-29b-3p on cellular function. (A) MTT assay detected cell viability. (B) Colony forming assay. (C) Transwell assay detected cell migration. (D) Transwell assay detected cell invasion. *P < 0.05, **P < 0.01.
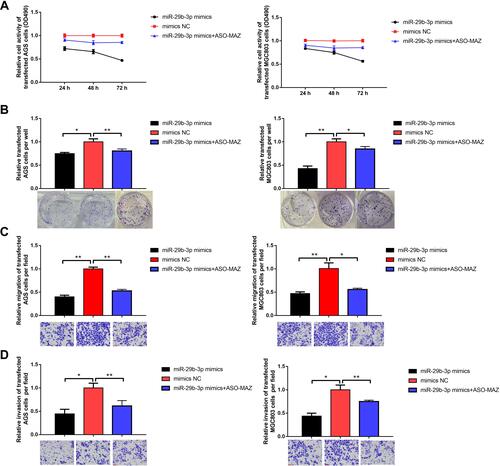
Table 2 The Interference Sequences of the shRNAs for MAZ Knocking Out
Figure 3 Effects of blocking MAZ expression on cellular function. (A) MAZ knockout efficiency of siRNA. (B) MTT assay detected cell viability. (C) Colony forming assay. (D) Transwell assay detected cell migration. (E) Transwell assay detected cell invasion. *P < 0.05, **P < 0.01.
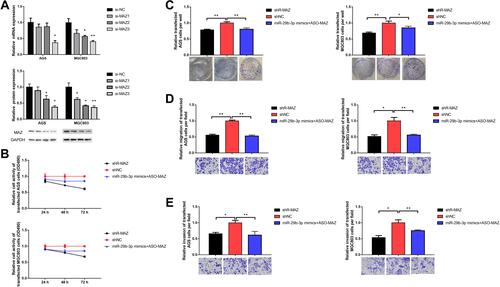
Figure 4 Expression levels of autophagy-related genes beclin 1, P62, and LC3 in transfected cells. (A) The mRNA expression level of autophagy-related genes in AGS cells transfected with the miR-29b-3p mimics and MAZ interference plasmid. (B) The mRNA expression level of autophagy-related genes in MGC cells transfected with the miR-29b-3p mimics and MAZ interference plasmid. (C) The protein expression level of autophagy-related genes in transfected AGS cells. (D) The protein expression level of autophagy-related genes in transfected MGC cells. *P < 0.05, **P < 0.01.
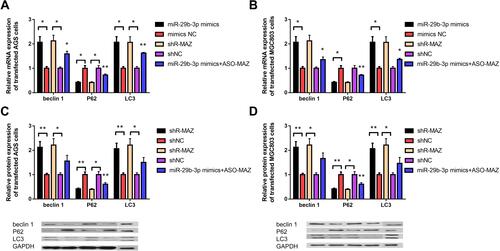
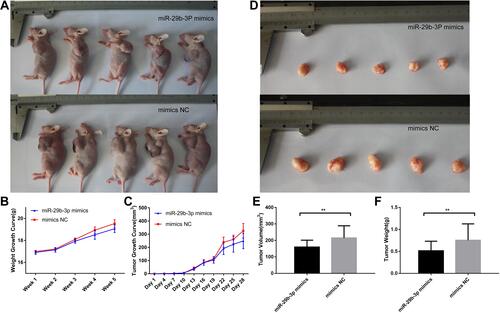
Figure 5 Body characteristics and tumour growth of nude mice injected with transfected AGS cells. (A) Nude mice body shape comparison, (B) Nude mice body weight growth curve, (C) Nude mice tumour growth curve, (D) Nude mice tumour comparison, (E) Nude mice tumour volume after removal. (F) Nude mice tumour weight after removal. **P < 0.01.