Figures & data
Table 1 Association of Circ-PGAP3 Expression with Clinical Features in 86 Triple-Negative Breast Cancer Patients
Figure 1 Circ-PGAP3 is overexpressed in TNBC tissues. (A) qRT-PCR analysis of circ-PGAP3 level in 86 TNBC and matched normal tissues. (B, C) The overall and disease-free survival curves of patients with low and high circ-PGAP3 expression. (D) After MDA-MB-231 cells were treated with RNase R, the expression of circ-PGAP3 and PGAP3 was detected by qRT-PCR. (E, F) qRT-PCR and FISH testing the location of circ-PGAP3 in MDA-MB-231 cells. The difference between two groups was tested by Student’s t-test. **P<0.01, ***P<0.001.
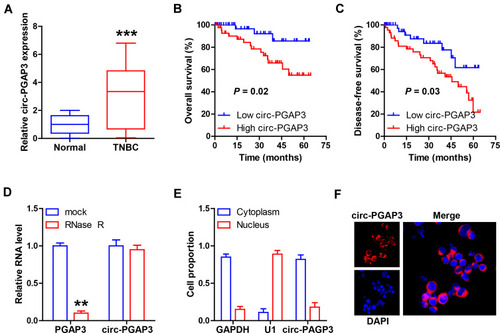
Figure 2 Inhibition of circ-PGAP3 reduces TNBC cell proliferation and invasion. (A) Cartoon showing the designed ASO targeting the junction site of circ-PGAP3 silencing circ-PGAP3. (B) qRT-PCR analysis of circ-PGAP3 and PGAP3 expression after transfection with ASO targeting circ-PGAP3. (C–E) CCK-8, colony formation and Transwell invasion assays testing cell viability, colony ability and invasion after circ-PGAP3 knockdown in the indicated two TNBC cell lines. The difference between two groups was tested by Student’s t-test. **P<0.01.
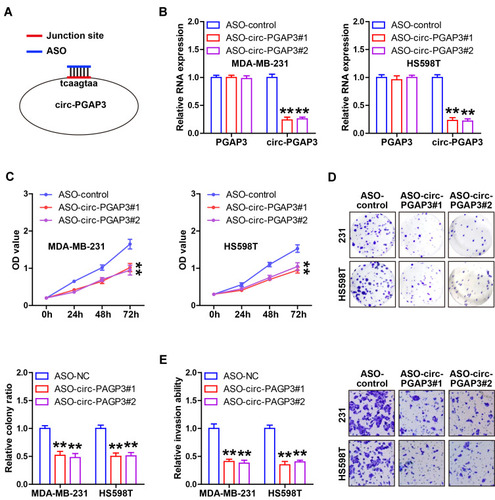
Figure 3 miR-330-3p is the downstream target of circ-PGAP3 in TNBC cells. (A) RIP assay using Ago2 antibody detecting the enrichment of circ-PGAP3 by Ago2. (B) The four miRNAs predicted by the indicated three databases. (C) qRT-PCR analysis following RNA pull-down assay verifying the availability of the designed biotin-labeled probes. (D) qRT-PCR analysis following RNA pull-down assay testing the miRNAs bound by circ-PGAP3. (E) The complementary sequences of circ-PGAP3 and miR-330-3p. (F) The luciferase reporter assay in the indicated two TNBC cells co-transfected with wild-type or mutant circ-PGAP3 vector and control or miR-330-3p mimics. (H) qRT-PCR analysis of miR-330-3p expression after circ-PGAP3 knockdown. (I) qRT-PCR analysis of miR-330-3p expression in TNBC and normal tissues. (J) The correlation between circ-PGAP3 and miR-330-3p expression in TNBC tissues. (K) FISH assay detecting the co-location between circ-PGAP3 and miR-330-3p. The difference between two groups was tested by Student’s t-test. **P<0.01, ***P<0.001.
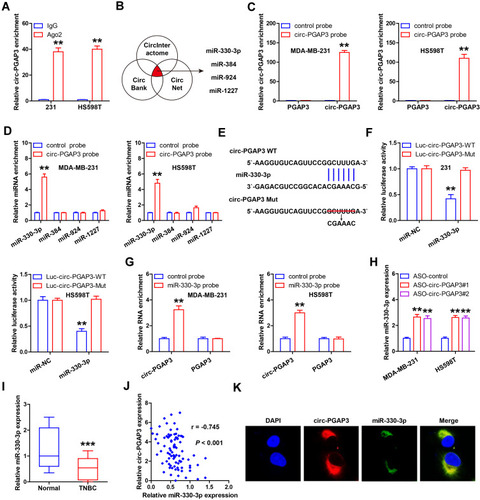
Figure 4 Identification of the circ-PGAP3/miR-330-3p/Myc axis in TNBC cells. (A) The complementary sequences of miR-330-3p and Myc 3′-UTR. (B) The luciferase reporter assay in the indicated two TNBC cells co-transfected with wild-type or mutant Myc 3′-UTR vector and control or miR-330-3p mimics. (C) qRT-PCR analysis of Myc mRNA expression in miR-330-3p-depleted TNBC cells transfected with ASO against circ-PGAP3. (D) Western blot analyzing the protein level of Myc in circ-PGAP3-depleted TNBC cells transfected with miR-330-3p inhibitors. (E) IHC staining of Myc in TNBC and normal tissues. (F) High Myc protein level was positively correlated with high circ-PGAP3 expression. (G–H) Cell viability and invasion were tested in circ-PGAP3-depleted TNBC cells transfected with miR-330-3p inhibitors or Myc expression plasmid. The difference between two groups was tested by Student’s t-test. *P<0.05, **P<0.01, ***P<0.001.
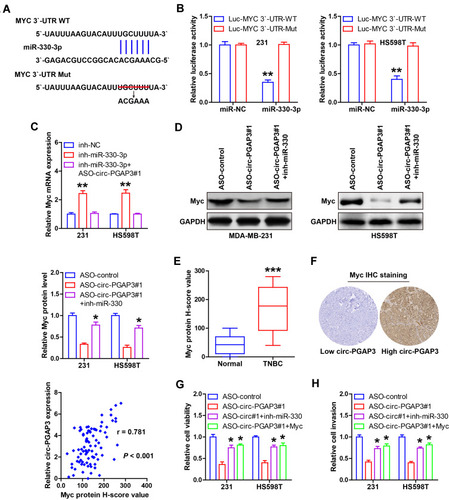
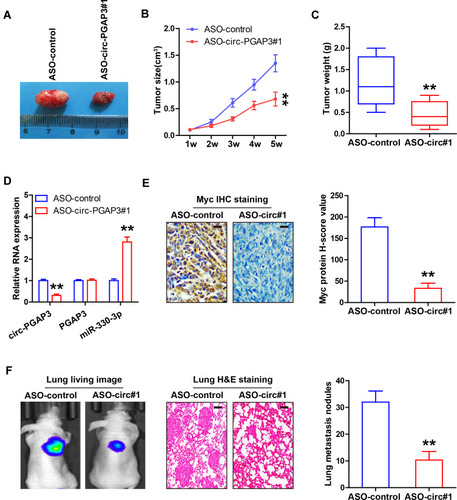
Figure 5 Knockdown of circ-PGAP3 inhibits in vivo TNBC cell growth and invasion. (A–C) Tumor image, volume and weight of nude mice bearing control and circ-PGAP3-depleted MDA-MB-231 cells (n=5 per group). (D) qRT-PCR analysis of circ-PGAP3, PGAP3 and miR-330-3p expression in the indicated two groups. (E) IHC staining of Myc in tumor tissues of the indicated two groups. (F) IVIS@ Lumina II system and H&E staining evaluating lung metastasis in the indicated two groups (n=5 per group). Scale bar=25 μm. The difference between two groups was tested by Student’s t-test. **P<0.01.