Figures & data
Figure 1 CircSEC24A expression was enhanced in CSCC tissues and cells. (A) GSE74758 from the GEO database was analyzed to determine the expression of circSEC24A in CSCC tissues and normal tissues (Student’s t-test). (B) The basic information of circSEC24A was shown. (C) The expression of circSEC24A was detected by qRT-PCR in CSCC tissues and adjacent normal tissues (Student’s t-test). (D) CircSEC24A expression was analyzed by qRT-PCR in patients with stages I, II, III, and IV (ANOVA). (E) The level of circSEC24A was measured by qRT-PCR in CSCC cells (SCC13 and Colo16) and human keratinocyte cells (HaCaT) (ANOVA). (F and G) The levels of circSEC24A and SEC24A mRNA were determined after treatment of RNase R by qRT-PCR (ANOVA). (H) The overall survival rate was analyzed by Kaplan-Meier analysis in CSCC patients with high and low circSEC24A expression. *P<0.05.
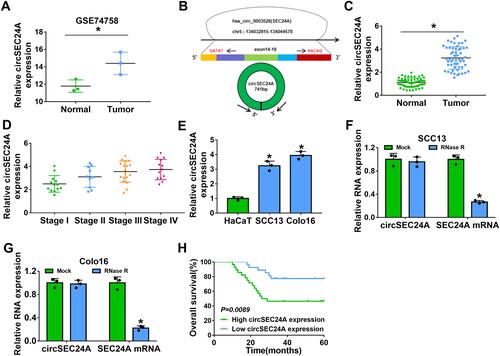
Figure 2 CircSEC24A knockdown repressed the progression of CSCC cells. SCC13 and Colo16 cells were transfected with si-NC or si-circSEC24A. (A and B) Knockdown efficiency of circSEC24A was determined by qRT-PCR (Student’s t-test). (C and D) MTT assay was employed to evaluate cell viability (ANOVA). (E) Colony formation assay was utilized to examine the number of colonies (ANOVA). (F) Flow cytometry analysis was used to determine the apoptosis rate (ANOVA). (G and H) Transwell assay was applied to assess cell migration and invasion (100×) (ANOVA). (I) Lactate production was assessed using a lactate assay kit (ANOVA). (J) Glucose consumption was measured by a glucose assay kit (ANOVA). (K and L) ECAR was detected using a Seahorse Bioscience XF24 extracellular flux analyzer (ANOVA). (M and N) Western blot assay was conducted to measure the protein levels of HK2 and LDHA (ANOVA). *P<0.05.
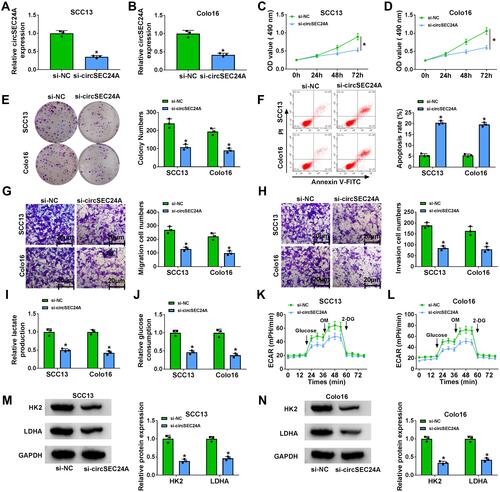
Figure 3 CircSEC24A could interact with miR-1193 in CSCC cells. (A) The potential binding sites of miR-1193 and circSEC24A were predicted by starBase v2.0. (B and C) SCC13 and Colo16 cells were co-transfected with circSEC24A WT or circSEC24A MUT and miR-1193 or miR-NC, and then relative luciferase activity was measured (ANOVA). (D and E) The enrichment of circSEC24A and miR-1193 was measured by RIP assay in SCC13 and Colo16 cells incubated with Anti-AGO2 or Anti-IgG (ANOVA). (F) The enrichment of circSEC24A was examined by RNA pull-down assay in SCC13 and Colo16 cells incubated with bio-NC or bio-miR-1193 (ANOVA). (G) The expression of miR-1193 was detected by qRT-PCR in SCC13 and Colo16 cells transfected with si-NC or si-circSEC24A (ANOVA). (H and I) The level of miR-1193 was analyzed by qRT-PCR in normal tissues, CSCC tissues, HaCaT cells and CSCC cells (SCC13 and Colo16) s (Student’s t-test and ANOVA). (J) The correlation between miR-1193 expression and miR-1193 expression was analyzed in CSCC tissue (Pearson). *P<0.05.
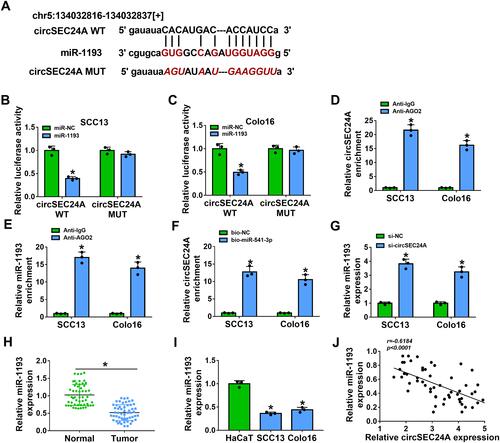
Figure 4 Downregulation of miR-1193 reversed the inhibitory effect of si-circSEC24A on the progression of CSCC cells. SCC13 and Colo16 cells were transfected with si-NC, si-circSEC24A, si-circSEC24A + anti-miR-NC, or si-circSEC24A + anti-miR-1193. (A and B) QRT-PCR was used to determine the expression of miR-1193 (ANOVA). (C and D) MTT assay was utilized to measure cell viability (ANOVA). (E) The number of colonies was determined by colony formation assay (ANOVA). (F) Flow cytometry analysis was applied to test the apoptosis rate. (G and H) Cell migration and invasion were examined by transwell assay (100×) (ANOVA). (I and J) Lactate production or glucose consumption was measured by lactate assay kit or glucose assay kit, respectively (ANOVA). (K and L) Seahorse Bioscience XF24 extracellular flux analyzer was used to detect ECAR (ANOVA). (M and N) The protein levels HK2 and LDHA were analyzed by Western blot analysis (ANOVA). *P<0.05.
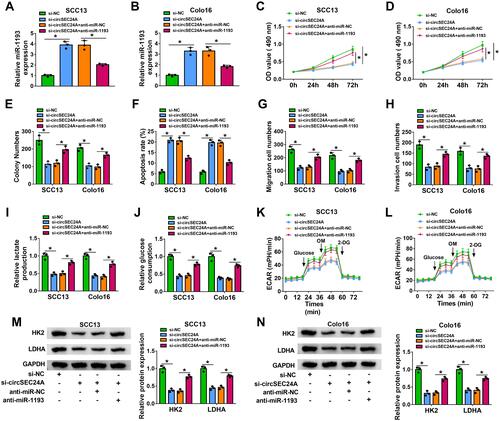
Figure 5 MAP3K9 was a direct target of miR-1193 in CSCC cells. (A) The putative binding sites between miR-1193 and MAP3K9 3ʹ-UTR were predicted by starBase v2.0. (B and C) Relative luciferase activity was determined in SCC13 and Colo16 cells co-transfected with MAP3K9 3ʹ-UTR-WT or MAP3K9 3ʹ-UTR-MUT and miR-1193 or miR-NC (ANOVA). (D) The enrichment of MAP3K9 was determined by RNA pull-down assay in SCC13 and Colo16 cells incubated with bio-NC or bio-miR-1193 (ANOVA). (E) Western blot assay was employed to measure the protein expression of MAP3K9 in SCC13 and Colo16 cells transfected with miR-NC or miR-1193 (ANOVA). (F and G) The mRNA and protein expression of MAP3K9 in normal and CSCC tissues were measured by qRT-PCR and Western blot analyses, respectively (Student’s t-test and ANOVA). (H) Western blot assay was applied to examine the protein expression of MAP3K9 in HaCaT cells and CSCC cells (SCC13 and Colo16) (ANOVA). (I and J) The correlation between MAP3K9 and miR-1193 or circSEC24A expression was analyzed in CSCC tissues (Pearson). (K) The enrichment of MAP3K9 was detected by RNA pull-down assay in SCC13 and Colo16 cells incubated with bio-NC or bio-circSEC24A (ANOVA). (L) The protein level of MAP3K9 was measured by Western blot assay in SCC13 and Colo16 cells transfected with si-NC, si-circSEC24A, si-circSEC24A + anti-miR-NC, or si-circSEC24A + anti-miR-1193 (ANOVA). *P<0.05.
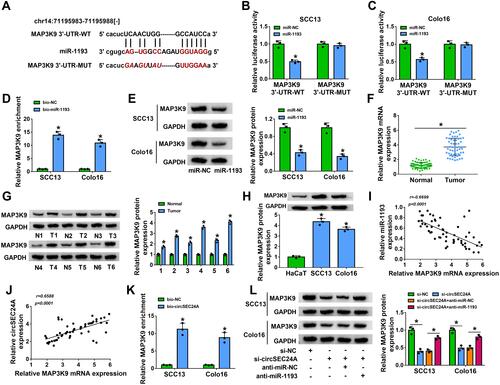
Figure 6 Overexpression of MAP3K9 abated the suppressive effect of miR-1193 upregulation on the progression of CSCC cells. SCC13 and Colo16 cells were transfected with miR-NC, miR-1193, miR-1193 + vector, or miR-1193 + MAP3K9. (A) Western blot assay was utilized to analyze the protein expression of MAP3K9 (ANOVA). (B and C) Cell viability was assessed by MTT assay (ANOVA). (D) Colony formation ability was evaluated using colony formation assay (ANOVA). (E) Cell apoptosis was analyzed by flow cytometry analysis (ANOVA). (F and G) Transwell assay was employed to determine cell migration and invasion (100×) (ANOVA). (H and I) Lactate production or glucose consumption was measured by lactate assay kit or glucose assay kit, respectively (ANOVA). (J and K) ECAR was analyzed by Seahorse Bioscience XF24 extracellular flux analyzer (ANOVA). (L and M) Western blot assay was carried out to determine the protein levels of HK2 and LDHA (ANOVA). *P<0.05.
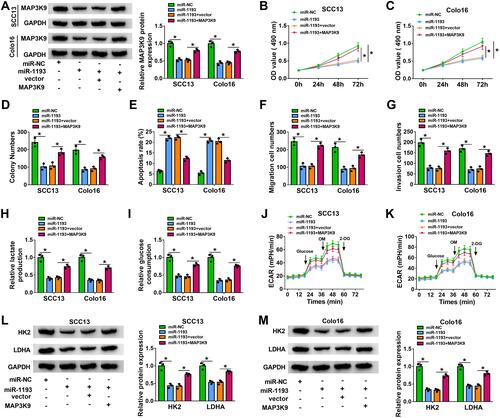
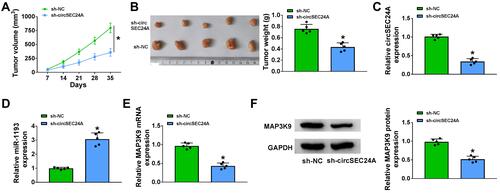
Figure 7 CircSEC24A interference inhibited tumor growth by upregulating miR-1193 and downregulating MAP3K9. Sh-NC- or sh-circSEC24A-transfected SCC13 cells were introduced into nude mice to establish mice xenograft model. (A and B) Tumor volume and weight were measured (ANOVA and Student’s t-test). (C–E) QRT-PCR was conducted to detect the expression levels of circSEC24A, miR-1193 and MAP3K9 in resected tumor tissues (Student’s t-test). (F) Western blot assay was performed to analyze the protein expression of MAP3K9 in resected tumor tissues (Student’s t-test). *P<0.05.